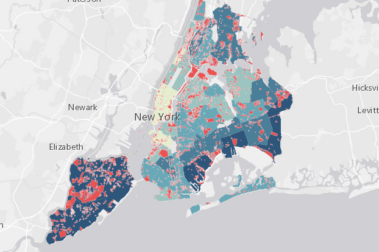
It empowers New Yorkers to understand the energy, water, and climate change impacts of the spaces they rent and buy and to identify top performing buildings in the city. It does this through an intuitive interface that provides GHG, energy, and water efficiency details for specific buildings and how their performance compares to other buildings in the city.
This Map leverages data collected through NYC’s Local Law 84, one of the first energy and water reporting ordinances passed in the US. LL84 has become a model for cities grappling with the challenge of reducing greenhouse gas emissions in buildings. This law requires private buildings over 25,000 ft2 and public sector buildings over 10,000 ft2 to report their energy and water consumption each year for public disclosure.
The NYC Energy & Water Performance Map provides an easy to use interface to help users compare annual energy and water consumption data for roughly 2.3 billion ft2 in 23,000 private sector buildings and 281 million ft2 in 3,097 public sector buildings across the five boroughs.


