This section focuses on exposure to polluted air across five issues and indicators: outdoor air pollution, stationary sources of pollution, mobile sources of pollution, solid waste facilities, and indoor air quality. The findings point to opportunities for the City to invest in environmental justice communities, improve accountability through increased data transparency, and coordinate with permitting and regulatory authorities to embed equity and environmental justice considerations in the siting and permitting of infrastructure.
In the middle of the 20th century, New York City had the most polluted air of any big city in the United States.202 Pollution from coal-fired power plants, municipal and residential waste incinerators, motor vehicle and maritime traffic, highly polluting industries, commercial cooking, and oil-fired boilers in buildings resulted in two “killer smog” incidents in November of 1953 and 1966, causing an estimated 400 deaths.203 Following the 1966 smog, City officials strengthened the NYC Air Pollution Control Codes. Shortly thereafter, national concerns about air pollution and other environmental justice issues led to the establishment of the United States Environmental Protection Agency (US EPA) and the passage of the Clean Air Act in 1970.204 In the decades since, EJ communities have pushed for reforms to improve New York City’s air quality, resulting in the closing of all municipal waste incinerators in the city in 1994, the passing of legislation to phase out fossil fuels from new construction starting in 2024, and citywide planning to replace “peaker” power plants with renewable energy solutions.205, 206, 207, 208, 209
New York City’s regional air quality is vastly better than it was 60 years ago and continues to improve. Challenges remain, however, particularly with regards to the negative health impacts EJ communities experience because of polluted air.211Efforts to reduce air pollution should focus on neighborhoods with the worst health impacts. (2022). NYC DOHMH. NYC Government. The city also faces new obstacles in the face of a changing climate. Hotter summers and dryer conditions increase the frequency and intensity of wildfires which can inundate New York City with dangerous levels of air pollution for days at a time, events which were common throughout June and July of 2023.212Wildfire Smoke and High Heat Have Something in Common. Guess What. (2023). Zhong, R. and Erdenesanaa, D. The New York Times. News Article.
Key Findings
The NYC neighborhoods with the greatest levels of pollution-attributable hospital emergency department visits are all EJ Neighborhoods.

Nearly all neighborhoods with the highest pollution-attributable emergency department visits are within a mile of a large stationary source polluting facility, such as a power plant or manufacturing facility.
![]()
Communities of color are disproportionately exposed to emissions from heavy-duty diesel vehicles, compared to communities that are mostly white, due to the location of arterial highways, commercial waste routes, delivery routes, and parking facilities for medium and heavy-duty fleets. These vehicles are major sources of NOx and PM2.5 emissions in NYC.210
![]()
Most of the city’s waste is processed and transferred in a handful of EJ Areas, increasing heavy-duty vehicle traffic in those communities. Many of these same neighborhoods suffer from the highest rates of pollution-attributable health impacts, sometimes at over three times the citywide average rates.
Data Analysis
Outdoor Air Pollution
The New York State Department of Environmental Conservation (DEC) measures outdoor air pollution through a series of federally mandated and supplemental monitoring networks, reporting these measurements to the US EPA’s Air Quality System (AQS). Focused on measuring ambient air quality at the regional scale, there are just over 50 DEC air monitoring sites across the entire state, including 17 within New York City boundaries.2132022 Annual Monitoring Network Plan—New York State Ambient Air Monitoring Program. (2022). Bureau of Air Quality Surveillance, Division of Air Resources, NYS Department of Environmental Conservation. NYS Government. DEC’s monitoring network uses high quality, professionally calibrated monitoring equipment and quality control processes to produce reliable and repeatable data across almost 100 pollutants over several decades. DEC also carries out short term localized monitoring efforts to address specific questions or in response to legislation such as the 2022-23 mobile monitoring campaign in disadvantaged communities required by the New York State Climate Act.
In an effort to understand and track neighborhood variation in air quality over time, better represent human exposure and address the sparseness of DEC monitoring network, the Department of Health and Mental Hygiene (DOHMH) operates the largest urban air monitoring program in the United States, in close collaboration with Queens College of the City University of New York (CUNY). Established in 2008, the New York City Community Air Survey (NYCCAS) collects air quality measurements of six pollutants: fine particulate matter (PM2.5); black carbon (BC); nitrogen dioxide (NO2) and nitric oxide (NO), which together are (NOx); wintertime sulfur dioxide (SO2); and summertime ozone (O3). Measurements are taken from 78 strategically chosen locations to ensure representative coverage across the city, as well as near “high-emission locations” such as Times Square, the Port Authority Bus Terminal, and the entrance to the Holland Tunnel. An additional 15 monitors are sited in EJ Neighborhoods to better understand localized emissions in these communities (see Program/Policy Spotlight: NYC Community Air Survey on p. 78). DOHMH uses measurements at these locations to build statistical models that estimate average air pollution levels for each season across the city.214The New York City Community Air Survey: Neighborhood Air Quality 2008-2020. (2020). NYC DOHMH. NYC Government., 215Special monitoring for environmental justice. (2020). NYC DOHMH. NYC Government. These estimates cannot be compared to regulatory standards but can be used to track changes in air quality over time and help understand what factors drive differences across NYC neighborhoods. NYCCAS now has over 13 years of data at the neighborhood level to track changes over time.
The table on the following page provides an overview of the pollutants that DOHMH monitors through the NYCCAS program, the primary indicators that drive the disparities of each pollutant across NYC, the associated health risks caused by each pollutant, and the neighborhoods which experience the greatest levels of each pollutant. While NYCCAS has historically measured SO2, recent levels have been so low as to be considered undetectable. This is due in large part to Local Law 43 of 2010 and Local Law 38 of 2015, which phased out the most polluting heating oils from buildings.216, 217Local Laws of the City of New York for the year 2015: No. 38. (2015). NYC City Council. NYC Government.
New York City’s Regional Air Quality is Vastly Better Than It Was 60 Years Ago and Continues to Improve. Challenges Remain, However, with Regards to the Negative Health Impacts EJ Communities Experience Because of Polluted Air. the City Also Faces New Obstacles in the Face of a Changing Climate.
The factors that influence outdoor air quality in each neighborhood are complex. Geography, weather, and human activity play a role. While local emissions account for much of the city’s pollution levels, weather patterns can carry O3 and PM2.5 from power plants as far away as the Midwest, and industrial pollution from New Jersey regularly blows across the Hudson River, Kill Van Kull, and Arthur Kill straits into New York City. A recent study estimated that approximately 30 percent of the fine particulate matter in New York City’s air comes from regional, rather than local, sources.218Long-term trends in local and transported PM2.5 pollution in New York City. (2021). Pitiranggon, M., Johnson, S., Haney, J., Eisl, H., Ito, K. Atmospheric Environment, 248. Academic Research.
Pollutants Monitored through the NYCCAS Program
| POLLUTANT | DESCRIPTION219 | EMISSIONS INDICATORS220 | HEALTH RISKS221 | NEIGHBORHOODS IN NYC WITH GREATEST LEVELS OF POLLUTANT222 |
|---|---|---|---|---|
|
Fine Particles (PM2.5) |
Fine particles are airborne combustion particles, organic compounds, metals, or other materials less than 2.5 microns in diameter. |
• Emissions from commercial cooking • Emissions from motor vehicle traffic • Emissions from trucks associated with industrial land use |
PM2.5 is the most harmful urban air pollutant. It can worsen asthma, lung diseases, heart conditions, and leads to more than 2,000 premature deaths and over 6,500 emergency department visits every year.223Assessing Air Quality and Public Health Benefits of New York City’s Climate Action Plans. (2020). Johnson, S., Haney, J., Cairone, L., Huskey, C., and Kheirbek, I. Environmental Science & Technology, |
Midtown-Midtown South, Gramercy, East Village, Hudson Yards-Chelsea-Flatiron-Union Square, Clinton, Murray Hill-Kips Bay, Chinatown, Turtle Bay-East Midtown, East Williamsburg, Hunters Point- Sunnyside-West Maspeth |
|
Black Carbon |
Black carbon is a type of fine particle emitted when fossil fuels are burned by cars, power plants, and other sources. 20 percent of the PM2.5 in NYC is black carbon. |
• Emissions from trucks associated with industrial land use • Emissions from motor vehicle traffic • Combustion of fossil fuels for building heating and hot water |
Black carbon has been associated with respiratory and cardiovascular disease, cancer, and birth defects. |
East Williamsburg, Midtown- Midtown South, Hunters Point-Sunnyside-West Maspeth, Hudson Yards- Chelsea-Flatiron-Union Square, Greenpoint, Gramercy, East Village, Clinton, Hunts Point, Chinatown |
|
Nitrogen Oxides (NOx) |
Nitrogen dioxide (NO2) and nitric oxide (NO), which together are referred as nitrogen oxides (NOx) are produced by many mobile sources of pollution, such as cars, trucks, and marine vessels, and by oil-fueled boilers, power plants, and construction equipment. |
• Emissions from trucks associated with industrial land use • Emissions from motor vehicle traffic • Emissions from buses • Combustion of oil-fueled boilers and other fossil gas combustion, such as power plants |
Exposure to NOx is associated with increased hospitalizations for asthma and other respiratory conditions. |
Nitrogen dioxide (NO2): East Williamsburg, Hunters Point-Sunnyside-West Maspeth, Greenpoint, Maspeth, Sunset Park West, Bushwick North, Midtown-Midtown South, Mott Haven-Port Morris, Hunts Point, Hudson Yards-Chelsea- Flatiron-Union Square Nitric oxide (NO): Midtown-Midtown South, Turtle Bay-East Midtown, Murray Hill-Kips Bay, Clinton, Hudson Yards-Chelsea- Flatiron-Union Square, Gramercy, Upper East Side- Carnegie Hill, Chinatown, East Village, Lenox Hill-Roosevelt Island |
|
Ozone (O3) |
Ozone forms when NOx combines with sunlight, heat and other pollutants, and is more prevalent during the summer and extreme heat events. |
• Levels of NOx • Lack of tree cover (which reduces ozone through a reaction with leaf surfaces) |
Ozone is responsible for over 400 premature deaths, 850 hospitalizations for asthma, and 4,500 emergency department visits each year.224Air Pollution and Health of New Yorkers: The Impact of Fine Particles and Ozone. (2011). NYC DOHMH. NYC Government. |
Rikers Island, Pelham Bay- Country Club-City Island, Schuylerville-Throgs Neck-Edgewater Park, Soundview-Castle Hill- Clason Point-Harding Park, Whitestone, East Elmhurst, Seagate-Coney Island, Steinway, College Point, Ft. Totten-Bay Terrace-Clearview |
Since the first year of monitoring in 2009, NYCCAS has recorded steep decreases in annual average levels of all measured pollutants, with the exception of O3, which largely results from emissions outside of the city. Annual average levels of PM2.5 have been reduced by 43 percent, NO2 by 39 percent, NO by 56 percent, and SO2 by 98 percent.225, 226 These reductions are due in large part to Local Law 38 of 2015, which resulted in significant revisions to the New York City Air Pollution Control Code (Air Code) that regulated previously unregulated sources of emissions, required building owners to convert to cleaner heating oils, and regulated Tier IV sources.227Local Law 38 of 2015. (2015). NYC City Council. NYC Government.
There are notable differences between the neighborhoods with the greatest levels of measured outdoor air pollutants and the neighborhoods with the greatest health impacts. Generally, the neighborhoods that experience the greatest levels of pollution are not the neighborhoods that suffer the most pollution-attributable health outcomes. Adverse health outcomes related to pollution are concentrated in low-income communities and communities of color, particularly Black and Hispanic or Latino communities. This is partly due to exposure to airborne pollutants, but also because neighborhoods with higher rates of poverty due to historic disinvestment tend to have higher baseline rates of health conditions, lower-quality housing, and less access to healthcare.228Efforts to reduce air pollution should focus on neighborhoods with the worst health impacts. (2022). NYC DOHMH. NYC Government.
The following tables show the top ten areas of NYC with the greatest rate of emergency department visits attributable to PM2.5 and O3 for both adults and children. Almost all are EJ Neighborhoods, all have greater percentages of Black and/or Hispanic or Latino residents than NYC overall, and most are home to a majority of Black and Hispanic or Latino residents.
Adverse Health Outcomes Related to Pollution are Concentrated in Low- Income Communities and Communities of Color, Particularly Black and Hispanic or Latino Communities.
Adult Emergency Department Visits Attributable to PM2.5 per Year
| NEIGHBORHOOD (UHF42) | ADULT EMERGENCY DEPARTMENT VISITS ATTRIBUTABLE TO PM2.5 PER YEAR (PER 100,000 RESIDENTS) | PERCENTAGE OF CENSUS TRACTS CLASSIFIED AS AN EJ AREA |
|---|---|---|
|
Citywide |
34.6 |
44% |
|
East Harlem, MN* |
111.6 |
94% |
|
Hunts Point—Mott Haven, BX* |
104.6 |
100% |
|
High Bridge – Morrisania, BX* |
98.1 |
100% |
|
Central Harlem—Morningside Heights, MN* |
95.1 |
88% |
|
Crotona -Tremont, BX* |
87.1 |
100% |
|
East New York, BK* |
71.4 |
100% |
|
Bedford Stuyvesant—Crown Heights, BK* |
68.1 |
76% |
|
Williamsburg – Bushwick, BK* |
67.3 |
99% |
|
Fordham—Bronx Park, BX* |
64.1 |
97% |
|
Northeast Bronx, BX* |
48.4 |
72% |
*EJ Neighborhood
SOURCE: NYC Department of Health and Mental Hygiene, Environment & Health Data Portal, 2022.
Child Emergency Department Visits Attributable to PM2.5 per Year
| NEIGHBORHOOD (UHF42) | CHILD EMERGENCY DEPARTMENT VISITS ATTRIBUTABLE TO PM2.5 PER YEAR (PER 100,000 RESIDENTS) | PERCENTAGE OF CENSUS TRACTS CLASSIFIED AS AN EJ AREA |
|---|---|---|
|
Citywide |
78.2 |
44% |
|
East Harlem, MN* |
215.5 |
94% |
|
Hunts Point—Mott Haven, BX* |
194.7 |
100% |
|
Central Harlem—Morningside Heights, MN* |
193.1 |
88% |
|
High Bridge – Morrisania, BX* |
188.6 |
100% |
|
Crotona -Tremont, BX* |
167.2 |
100% |
|
Fordham—Bronx Park, BX* |
153.6 |
97% |
|
Bedford Stuyvesant—Crown Heights, BK* |
124.6 |
76% |
|
East New York, BK* |
118.4 |
100% |
|
Northeast Bronx, BX* |
108.6 |
72% |
|
Williamsburg – Bushwick, BK* |
107.9 |
99% |
*EJ Neighborhood
SOURCE: NYC Department of Health and Mental Hygiene, Environment & Health Data Portal, 2022.
Adult Emergency Department Visits Attributable to O3 per Year
| NEIGHBORHOOD (UHF42) | ADULT EMERGENCY DEPARTMENT VISITS ATTRIBUTABLE TO O3 PER YEAR (PER 100,000 RESIDENTS) | PERCENTAGE OF CENSUS TRACTS CLASSIFIED AS AN EJ AREA |
|---|---|---|
|
Citywide |
48.3 |
44% |
|
East Harlem, MN* |
141.5 |
94% |
|
Hunts Point—Mott Haven, BX* |
130.1 |
100% |
|
High Bridge – Morrisania, BX* |
124.9 |
100% |
|
Central Harlem—Morningside Heights, MN* |
121.4 |
88% |
|
Crotona -Tremont, BX* |
112 |
100% |
|
East New York, BK* |
107.8 |
100% |
|
Bedford Stuyvesant—Crown Heights, BK* |
100.2 |
76% |
|
Williamsburg – Bushwick, BK* |
96.7 |
99% |
|
Fordham—Bronx Park, BX* |
85.5 |
97% |
|
Port Richmond, SI* |
74.6 |
81% |
*EJ Neighborhood
SOURCE: NYC Department of Health and Mental Hygiene, Environment & Health Data Portal, 2022.
Child Emergency Department Visits Attributable to O3 per Year
| NEIGHBORHOOD (UHF42) | CHILD EMERGENCY DEPARTMENT VISITS ATTRIBUTABLE TO O3 PER YEAR (PER 100,000 RESIDENTS) | PERCENTAGE OF CENSUS TRACTS CLASSIFIED AS AN EJ AREA |
|---|---|---|
|
Citywide |
101.9 |
44% |
|
East Harlem, MN* |
262.3 |
94% |
|
Central Harlem—Morningside Heights, MN* |
228.6 |
88% |
|
Hunts Point—Mott Haven, BX* |
225 |
100% |
|
High Bridge – Morrisania, BX* |
220.8 |
100% |
|
Crotona – Tremont, BX* |
199.6 |
100% |
|
Fordham—Bronx Park, BX* |
187.8 |
97% |
|
Bedford Stuyvesant—Crown Heights, BK* |
173.9 |
76% |
|
East New York, BK* |
163.6 |
100% |
|
Williamsburg – Bushwick, BK* |
145.3 |
99% |
|
Northeast Bronx, BX* |
143 |
72% |
*EJ Neighborhood
SOURCE: NYC Department of Health and Mental Hygiene, Environment & Health Data Portal, 2022.
Program/Policy Spotlight
Nyc Community Air Survey
LEAD AGENCY: NYC Department of Health and Mental Hygiene (DOHMH)
The New York City Community Air Survey began in 2008, becoming the largest ongoing urban air monitoring program in the United States. The program was developed to help inform the City’s sustainability plans, evaluate poor air quality exposure for health research, and educate the public about relevant topics such as changes in the sources of air pollution, City efforts to improve air quality, and related health impacts across NYC neighborhoods.
Monitoring sites were originally selected at random to represent a range of environments in New York City: sidewalks, busy streets, parks, and quiet neighborhood roads. Additional sites were later included to evaluate air quality in potentially high-emissions locations such as Times Square, Port Authority Bus Terminal and the entrance to the Holland Tunnel. Starting in 2014, the program also began monitoring air quality at environmental justice sites which were defined as monitor locations in high-poverty neighborhoods that have below-average density of air quality monitors or are near important emissions sources.229Air quality snapshots: special findings from 10 years of NYCCAS. (2022). NYC DOHMH. Environment and Health Portal. NYC Government.
Across the city, concentrations of pollutants including PM2.5, NOx, NO, O3 and sulfur oxides (SOx) saw a decline between 2009 and 2021.230 A comparison of PM2.5 readings taken at the survey’s environmental justice sites and estimates developed from data collected at routine sites showed that recorded values at the environmental justice sites were only 4 percent higher than the modeled estimates.231NYC Community Air Survey Annual Report. (2022). NYC DOHMH. Environment and Health Data Portal. NYC Government.This points to the model’s statistical accuracy amid calls for hyperlocal monitoring in EJ communities to better assess exposure to pollutants.232Community Air Mapping Project for Environmental Justice. (2021). NYC Environmental Justice Alliance. Community Organization.
While the results from a specific monitor does not provide conclusive evidence of the impact of a local pollution source, the analysis of the network as a whole alongside data on traffic, truck routes, buildings burning heating oil, restaurants, and warehouses allows the Health Department to confidently conclude what kinds of emissions sources are most important in causing poor air quality across NYC neighborhoods and report the results to City Council.233The New York City Community Air Survey: Neighborhood Air Quality 2008-2020. (2020). NYC DOHMH. NYC Government.This evidence is highlighted in data stories on the Environment and Health Data Portal that advocate for reduction in traffic, especially trucks, emissions controls in restaurants, and cleaner heating fuels.234Data Stories. (n.d.). NYC DOHMH. NYC Government.
Monitoring itself does not address environmental justice concerns but can be used to inform decision-making and investments and policies that address such concerns. In this vein, NYCCAS data has helped drive targeted initiatives to improve air quality throughout the city. Most recently, neighborhood level PM2.5 data from NYCCAS was used in the selection of 200 schools for the Mayor’s “Leading the Charge” plan—a $4 billion effort to electrify New York City schools and ending the use of highly polluting No. 4 heating oil at all schools, starting with communities most impacted by air pollution related health impacts.235Data Stories. (n.d.). NYC DOHMH. NYC Government.This is a best practice example of how transparent data collection by the City helps to equitably implement a plan, in this case improving air quality in communities disproportionately burdened by climate change and environmental injustice.
Stationary Sources of Pollution
A stationary source of pollution refers to any facility that emits pollutants from a fixed position. When fuel oil and methane gas are burned to generate heat or produce power for New Yorkers’ homes or when charbroilers create smoke from cooking food, byproducts such as NOx, PM2.5, SO2 and other pollutants are emitted into the air. These local emitters are a major contributor to overall air pollution in NYC. According to National Emissions Inventory (NEI) estimates from the EPA, stationary sources of pollution account for over 40 percent of annual NOx emissions in the city and over 80 percent of annual PM2.5 emissions.236 Residential fuel combustion is the single largest stationary source of NOx emissions, accounting for nearly half of the nitrogen oxides from stationary sources. Likewise, commercial cooking is the largest stationary source of PM2.5.
Individual stationary sources of pollution, such as power plants and industrial facilities also pose environmental justice concerns despite not being the largest contributors to the city’s overall air pollution. NEI data show that these large facilities overall account for around 6 percent of all PM2.5 produced in the city and 14 percent of NOx emissions. Power plants account for 4 percent and 5 percent of total PM2.5 and NOX emissions across NYC, respectively.237Data Stories. (n.d.). NYC DOHMH. NYC Government.
The majority of the city’s power generating stations and, as of 2021, 13 of the city‘s 19 ”peaker” plant facilities, were located in a handful of EJ Areas. In NYC, Title V facilities, which are sites where fuel combustion and other emissions are regulated by the federal government under Title V of the Clean Air Act, include large and small power stations, manufacturing facilities, wastewater resource recovery facilities (WRRF), and other facilities that, according to the US EPA definition, have ”actual or potential emissions at or above” a threshold of 100 tons of pollution per year, with lower thresholds for certain hazardous air pollutants.238Who Has to Obtain a Title V Permit? (2022). US EPA. US Government. To assess the impact of stationary sources of pollution in EJ Areas across NYC, this report analyzed Title V facilities and the distribution of power plants with an output capacity greater than 1 megawatt (MW).
When Fuel Oil and Methane Gas are Burned to Generate Heat or Produce Power for New Yorkers’ Homes or when Charbroilers Create Smoke from Cooking Food, Byproducts Such as Nox, Pm2.5, So2 and Other Pollutants are Emitted into the Air.
Polluting facilities impact New Yorkers across all five boroughs. As the following map shows, the neighborhoods with the greatest proximity to stationary polluting facilities include much of Manhattan and the Bronx, as well as much of the Brooklyn and Queens waterfronts, which historically shipped fuel and raw materials
by barge. Power plants were often built along waterfronts to receive coal shipments and facilitate once-through cooling systems that expelled heat into adjacent water bodies. Across the city, these industrial waterfronts are home to numerous communities of color and include households with some of the lowest incomes in the city.239NYC Climate Justice Agenda: Strengthening the Mayor’s OneNYC Plan. (2016). New York City Environmental Justice Alliance. Community Organization.DEP operates 14 WWRFs along industrial waterfronts, 10 of which are located within an EJ Area, and all but one are located within 0.1 miles of an EJ Area. These facilities treat a combined 1.3 billion gallons of wastewater every data. DEP routinely receives reports through environmental review and other formal and informal processes of noxious odors from WWRFs. While DEP has committed to odor controls, WWRFs require continuous investment to mitigate odors disproportionately impacting EJ Areas.
Stationary Sources of Pollution
This analysis observes the areas within 1 mile of all facilities with Title V permits (2020) and power plants with greater than 1 MW operating capacity (in operation in 2021).
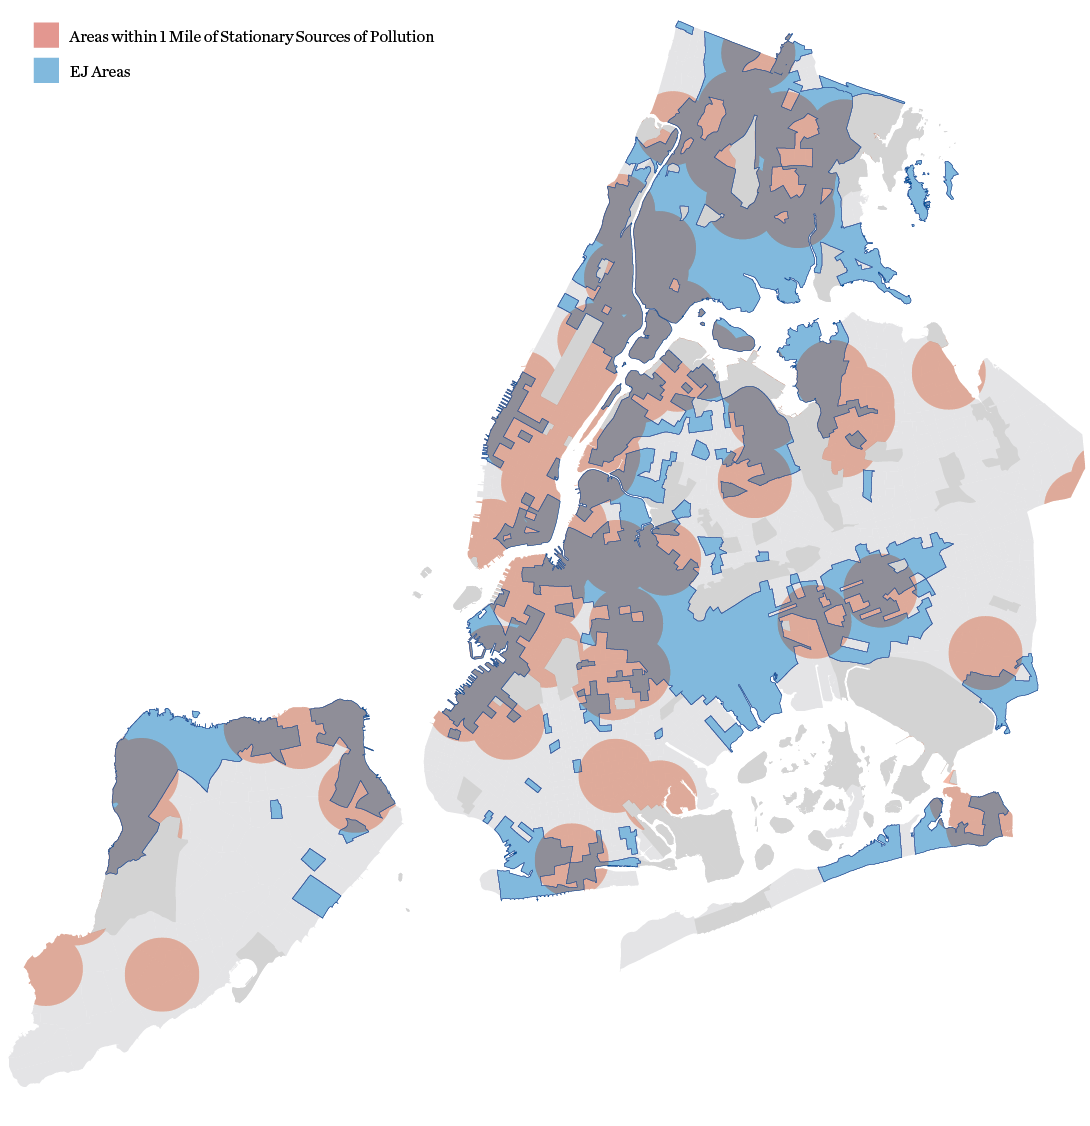
SOURCE: US Energy Information Administration, Form EIA-860, 2021. NYS Department of Environmental Conservation, Title V Emissions Inventory, 2020 facilities. NYS DEC, Disadvantaged Communities Criteria, 2023
However, because of the ubiquity of stationary sources of pollution across NYC, there are no major these facilities. Notably, many of the neighborhoods with the highest rates of PM2.5-attributable emergency department visits also fall within one mile of these facilities, including parts of Harlem, the South Bronx, and central Brooklyn. These neighborhoods also have considerable exposure to mobile sources of pollution, as discussed in the following sub-section, and other environmental burdens that contribute to their higher rates of emergency department visits. Four neighborhoods fall entirely within one mile of at least one polluting facility: Williamsburg, Bedford Park-Fordham North, Norwood, and East Elmhurst, all of which are EJ Neighborhoods.
A noteworthy limitation of the preceding analysis is that it treats all polluting facilities analyzed as being equally polluting. However, emissions vary among facilities, and a more precise accounting of the burdens created by these facilities would take into consideration the type of facility, type and quantity of pollutants emitted, height of smokestacks, exit velocity, wind direction and speed, pollution controls used, and topographic factors.240Mapping Environmental Injustices: Pitfalls and Potential of Geographic Information Systems in Assessing Environmental Health and Equity. (2002). Maantay, J. Environmental Health Perspectives,
Mobile Sources of Pollution
Mobile sources of pollution refer to any emissions that result from the combustion of fossil fuels by cars, trucks, and other vehicles or equipment that release fine particulate matter and black carbon. Of particular concern is the pollution that results from heavy-duty vehicles, including diesel trucks, solid waste carting vehicles, and maritime traffic, like the New York City and Staten Island ferry fleets, responsible for a particular type of particulate matter (diesel PM) that can cause irritation of the airways, heart and lung disease, and lung cancer, and is especially dangerous for children and older adults.241Diesel Particulate Matter. (2022). OEHHA. CA Government. Of similar concern are the industrial facilities that bring heavy truck traffic and other mobile sources of pollution into communities.
Sources of PM2.5 Pollution in New York City
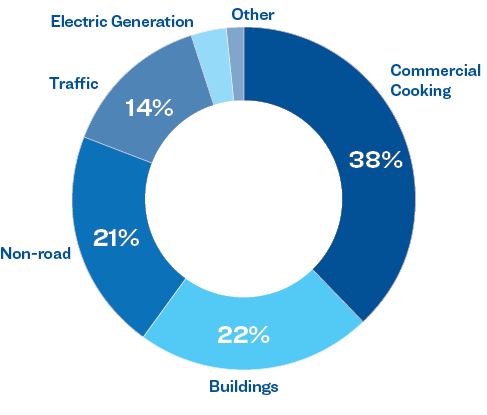
SOURCE: US Environmental Protection Agency, National Emissions Inventory (NEI) 2017 Report Dashboard, 2022
According to NEI estimates, mobile sources of pollution account for 59 percent of the NOx emissions in NYC every year.242National Emissions Inventory (NEI) 2017 Report Dashboard. (2022). US EPA. US Government. Mobile sources are responsible for 17 percent of the city’s PM2.5 emissions each year.243Ibid. They are also the source of 70 percent of the city’s black carbon, a particularly harmful component of PM2.5.244Ibid. Heavy-duty diesel vehicles are the greatest source of mobile NOx emissions, amounting to 22 tons of NOx per day, closely followed by light-duty vehicles, which emit around 20 tons of NOx per day.245Ibid. For PM2.5, the single greatest source of mobile pollution is non-road diesel equipment, which includes construction equipment, aircraft, marine vessels, and trains. 246National Emissions Inventory (NEI) Data and Documentation. (2022). US EPA. US Government. These sources emit over one ton of fine particulate matter per day in NYC.247National Emissions Inventory (NEI) 2017 Report Dashboard. (2022). US EPA. US Government.
For example, Stuyvesant Town-Cooper Village is situated next to FDR Drive, Washington Heights is next to the George Washington Bridge, and residents of Highbridge live at the convergence of the George Washington Bridge and the Cross Bronx Expressway. Many of the areas with the greatest vehicle traffic have populations that are primarily Asian and Pacific Islander, Black, and Hispanic or Latino, and four of the neighborhoods that experience the highest traffic volumes are EJ Neighborhoods.
Program/Policy Spotlight
Nyc Clean Trucks Program
LEAD AGENCY: NYC Department of Transportation (DOT)
The Clean Trucks Program began in 2012 as a voluntary pilot initiative to replace, retrofit, and scrap polluting, heavy-duty diesel trucks within the Hunts Point and Port Morris business communities of the South Bronx. Beginning in 2020, the program expanded to other areas in the outer boroughs. The program makes available incentive funding of between $12,000 and $185,000 per truck for participating diesel truck owners to turn in older vehicles and purchase new, low-to-zero emission vehicles.248NYC Clean Trucks Program: Available Funding. (n.dd). NYC DOT. NYC Government.By December 2022, the program had funded $20.6 million worth of truck replacements, with an additional $1.2 million in the approval pipeline.249NYC Clean Trucks Program: Draft Score Card for January 2012 – December 2022. (2022). NYC DOT. NYC Government.
The program prioritizes zero emission battery electric replacement trucks, while also offering incentives for the deployment of non-electric alternative fuel trucks and EPA-emission- compliant diesel trucks. Since the program’s inception, 134 businesses have been funded and a total of about 680 trucks have been replaced, retrofitted, or scrapped.250NYC Clean Trucks Program: Draft Score Card for January 2012 – December 2022. (2022). NYC DOT. NYC Government.Of the replacement trucks, 74 percent had new, lower-emission diesel engines, 14 percent had compressed natural gas (CNG) engines, 11 percent were hybrid electric vehicles, and 1 percent were battery electric vehicles.251 As a result, PM2.5 and NOx emissions from participating businesses have decreased by 97 percent and 89 percent over this period, respectively.252NYC Clean Trucks Program: Emission Results. (2022). NYC DOT. NYC Government.The Clean Trucks Program represents a small positive step towards addressing the larger issue of truck traffic emissions in New York City.
Distribution of Funding in Eligible Industrial Business Zones (IBZs)
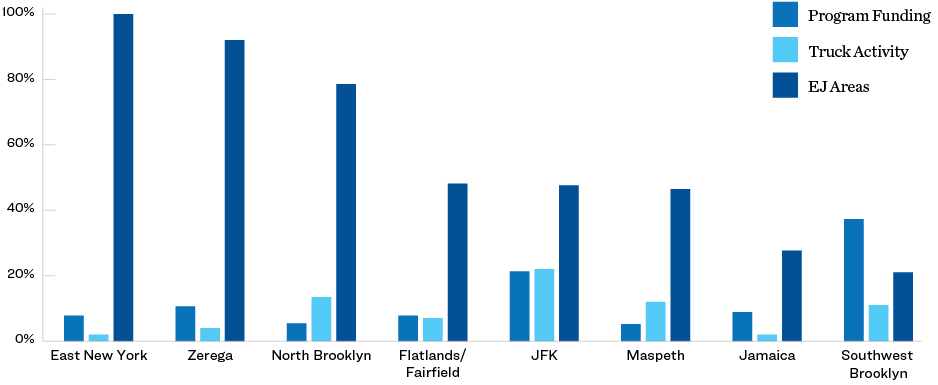
Sources: NYC Department of Transportation, NYC Clean Trucks Program: Draft Scorecard for January 2012 – December 2022, 2022; Delivering New York: A Smart Truck Management Plan, 2021. NYS Department of Environmental Conservation, Disadvantaged Communities Criteria, 2023
To be eligible for funding, qualifying trucks must operate within a half-mile of select Industrial Business Zones (IBZs) at least two times per week.253NYC Clean Trucks Program: IBZ Program Requirements. (2022). NYC DOT. NYC Government.Despite heavy truck traffic in Midtown Manhattan and the Financial District, trucks operating primarily in these two areas are not eligible because these areas are not IBZs.254Delivering New York: A Smart Truck Management Plan. (2021). NYC DOT. NYC Government.The eligible IBZs are all surrounded by EJ Areas; 62 percent of census tracts within the expanded program area are EJ Areas. As such, air quality improvements from the program’s emissions reductions are expected to primarily benefit low-income communities and communities of color, which face higher risk of negative health outcomes from air pollution.255Efforts to reduce air pollution should focus on neighborhoods with the worst health impacts. (2022). NYC DOHMH. NYC Government.
The Clean Trucks Program has the potential to significantly reduce truck emissions and improve air quality, and exemplifies how the City aims to prioritize investments in environmental justice communities. The program could also complement other sustainable transportation plans such as the low-emission freight zones proposed in PlaNYC, which would allow only low- and zero-emission trucks in certain areas of the city.256PlaNYC: Getting Sustainability Done. (2023). NYC MOCEJ. NYC Government.
Eligible Areas for Clean Trucks Program
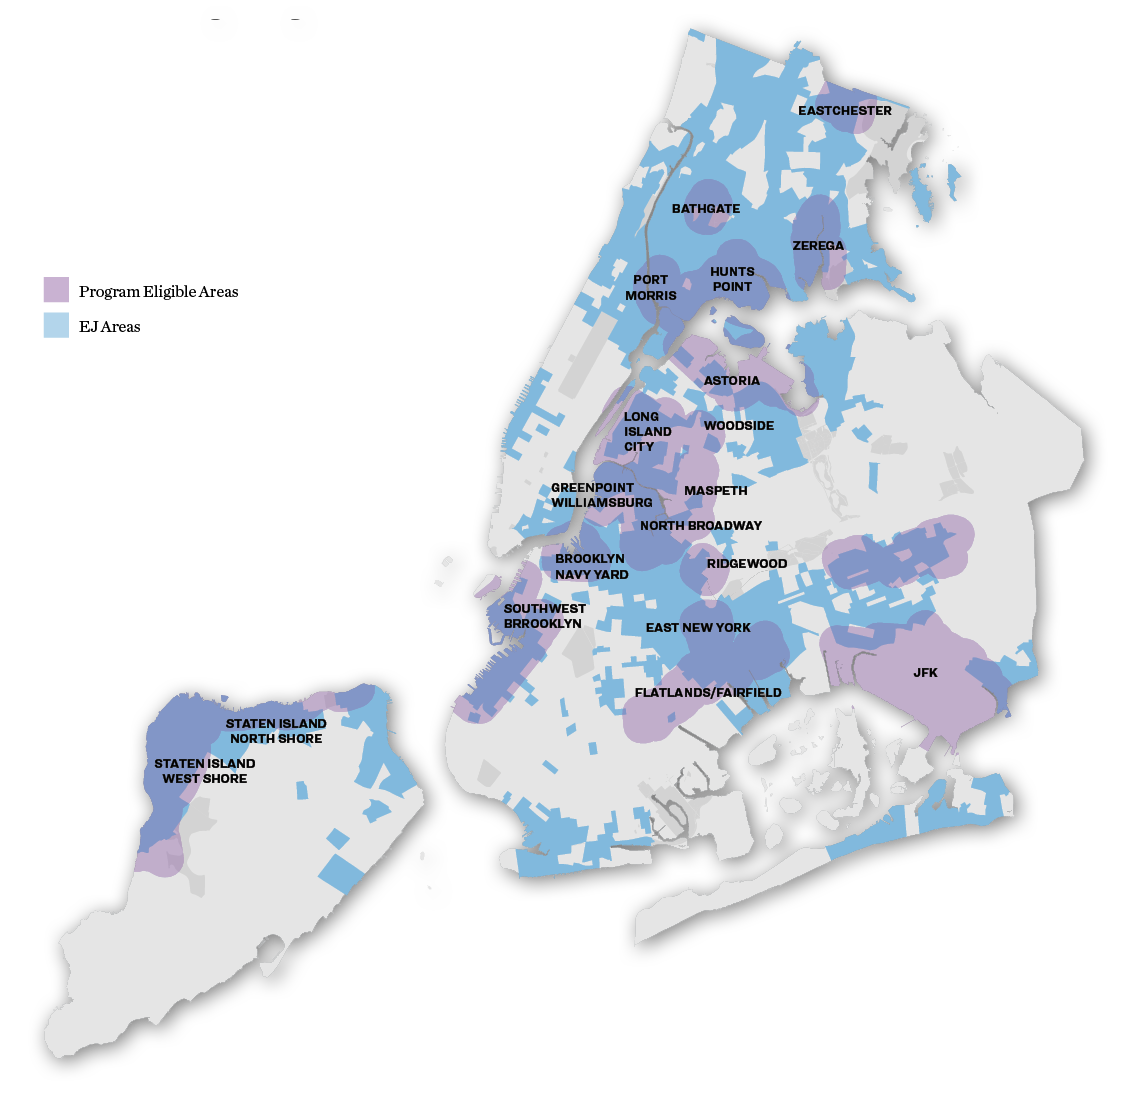
SOURCE: NYC Department of Transportation, Clean Trucks Program Eligibility Requirements. NYS Department of Environmental Conservation, Disadvantaged Communities Criteria, 2023
Note that this analysis offers only a partial picture of the ways in which EJ communities are impacted by mobile sources of pollution. A 2021 study that focused on pollution from heavy-duty trucks, a primary contributor to both PM2.5 and NOx emissions in the city, found that communities of color are subject to as much as 15 percent more PM2.5 pollution from diesel trucks than communities that are mostly white.257Air quality and health impacts of diesel truck emissions in New York City and policy implications. (2021). Meyer, M. and Dallmann, These higher levels of emissions put EJ communities at greater risk of contracting respiratory illnesses and heart disease. Furthermore, communities along the city’s industrial waterfront are exposed to an additional 19 tons of daily NOx emissions from marine vessels like container ships and cruise ships.258National Emissions Inventory (NEI) 2017 Report Dashboard. (2022). US EPA. US Government.
Transportation infrastructure, such as airports, bus depots, and last-mile warehouses, expose nearby communities to mobile sources of pollution. In East Elmhurst, Queens, for example, the LaGuardia Airport exposes neighboring residents, who are predominantly Black and Hispanic or Latino, to emissions from aircraft and service vehicles. In recent years, last-mile warehouses have proliferated in NYC, due in large part to the rapid growth of the e-commerce industry. Last-mile warehouses are used to store goods to be delivered quickly to end consumers, unlike traditional warehouses, where goods are typically stored for longer periods of time. Last-mile facilities are therefore generally characterized by large inventory spaces, proximity to urban centers, and frequent truck traffic. In view of the proliferation of these facilities, the Last- Mile Coalition, a coalition of EJ and public health advocates, came together to raise awareness of the impact of last-mile facilities and the associated truck traffic on local air quality.259An Environmental Justice Crisis: Last-Mile Trucking Facilities. (n.d.). Last-Mile Coalition. Community Organization. While a comprehensive list of all last-mile facilities does not currently exist, the following map shows the distribution of existing and planned or potential last-mile warehouses in New York City identified for this report using available City and industry data. Of the existing and planned last-mile distribution centers, 68 percent are located within an EJ Area and all but six are located within ¼ mile of an EJ Area. Many of these facilities are clustered around Red Hook, East New York, and Newtown Creek. clustered around Red Hook, East New York, and Newtown Creek. It should be noted that impacts to local outdoor air quality can vary significantly by facility.
Top 10 Neighborhoods with the Highest Traffic Volume
| NEIGHBORHOOD (NTA) | ANNUAL AVERAGE DAILY TRAFFIC VOLUME WEIGHTED BY POPULATION, HEAVY DUTY VEHICLES | PERCENTAGE OF CENSUS TRACTS CLASSIFIED AS AN EJ AREA |
|---|---|---|
|
Stuyvesant Town-Cooper Village, MN |
28,316 |
0% |
|
Washington Heights South, MN* |
27,918 |
100% |
|
Highbridge, BX* |
27,334 |
100% |
|
Yorkville, MN |
26,837 |
10% |
|
East Elmhurst, QN* |
22,561 |
100% |
|
Jamaica Estates-Holliswood, QN |
22,492 |
0% |
|
Hamilton Heights, MN* |
21,695 |
100% |
|
Queensboro Hill, QN |
21,421 |
0% |
|
Upper West Side, MN |
21,118 |
8% |
|
Kew Gardens, QN |
20,298 |
0% |
*EJ Neighborhood.
SOURCE: NYS Department of Transportation, AADT Annual Volume of Vehicle Travel, 2019.
Distribution Centers
This map shows existing and planned or potential last-mile facilities in NYC that have been cataloged by DCP. This is not an exhaustive map of all last-mile facilities in NYC.
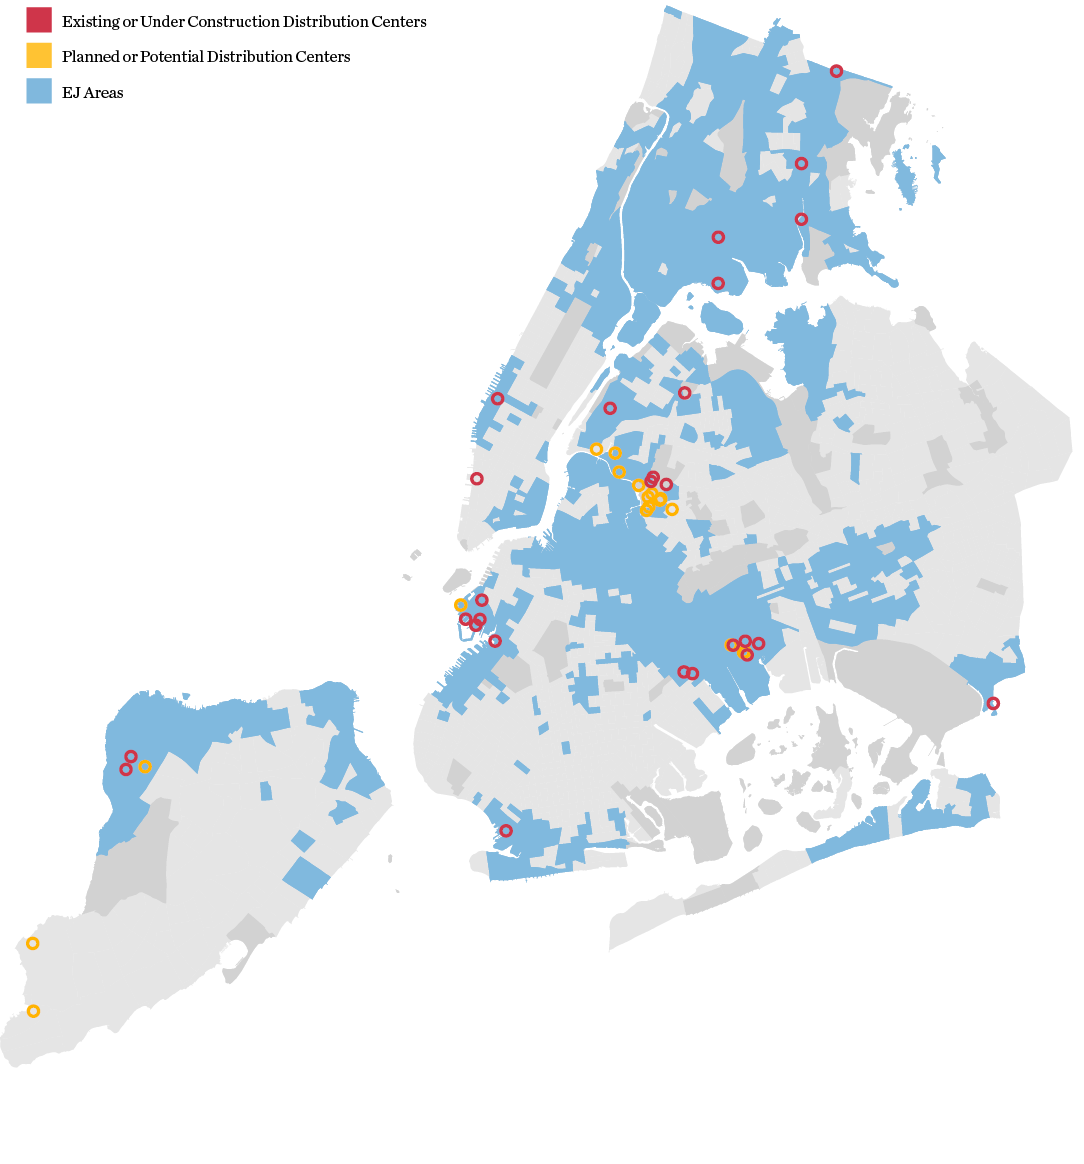
SOURCE: City of New York, Distribution Centers, 2022. MWPVL International Inc., Amazon Global Supply Chain and Fulfillment Center Network, 2022. NYS Department of Environmental Conservation, Disadvantaged Communities Criteria, 2023.
Solid Waste Facilities
Solid waste facilities are places where solid waste collected from across the city is delivered, separated, processed, and/or exported to recycling facilities, landfills and incinerators. Solid waste management in New York City is split along municipal and commercial lines, with the Department of Sanitation (DSNY) responsible for collection and management of waste generated by residents, institutions (including schools), and City agencies, while private carters provide waste management services to commercial entities, including the construction sector.260Solid Waste Management Plan. (2006). DSNY. NYC Government. Upon collection, non-recyclable waste is processed at transfer stations predominantly located in the outer boroughs and shipped on long-haul trucks, rail freight, and barges to out-of-city landfills or waste-to-energy facilities.261Rail Freight Capacity Analysis for Movement of New York City Waste. (2018). DSNY. NYC Government., 262DSNY Announces Final Contract to Transport Waste from Brooklyn by Barge. (2017). DSNY. NYC Government., 263Municipal Solid Waste in New York City: An Economic and Environmental Analysis of Disposal Options. (2017). Sylvan, D. New York League of Conservation Voters Education Fund. Nonprofit Organization. Solid waste facilities bring increased heavy-duty truck traffic to surrounding neighborhoods, which contributes to nitrogen oxide and particulate matter pollution. Additionally, dust and off-gassing from the waste itself pollutes the air and produces unpleasant odors, although this accounts for only a small fraction of air emissions across the city, according to NEI estimates.264National Emissions Inventory (NEI) 2017 Report Dashboard. (2022). US EPA. US Government.
The siting of solid waste facilities has long been a focal point of public advocacy and mobilization. Shifts in the City’s waste management strategy through the 1980s and 1990s resulted in an increased reliance on private waste transfer stations that receive waste for transport to disposal facilities outside of the city. Multiple reports have shown that these stations are disproportionately located within EJ communities compared to non-EJ communities; over 75 percent of the city’s solid waste stream is processed in a handful of low-income communities of color in North Brooklyn, the South Bronx, Sunset Park, and Southeast Queens.265Waste Equity Campaign. (n.d.). NYC Environmental Justice Alliance. Community Organization., 266Solid Waste Management and Environmental Justice: Building and Sustaining Coalitions. (2011). Center for Nonprofit Strategy and Management. Baruch College, School of Public Affairs. Academic Institution., 267New York City Nonprofit Advocacy Case Studies: Case Study 1, Solid Waste Management and Environmental Justice. (2011). Baruch College School of Public Affairs Center for Nonprofit Strategy and Management. Academic Institution. Over the last two decades, the City has taken steps to address these disparities. To learn more about DSNY’s waste equity efforts including the 2006 Solid Waste Management Plan (SWMP), A Closer Look at Waste Transfer Stations.
Top 10 Neighborhoods with the Highest Waste Transfer Throughput
| NEIGHBORHOOD (NTA) | TOTAL AVERAGE DAILY THROUGHPUT (TONS/DAY)V | NUMBER OF WASTE TRANSFER STATIONS | PERCENTAGE OF CENSUS TRACTS CLASSIFIED AS AN EJ AREA |
|---|---|---|---|
|
East Williamsburg, BK* |
4,854 |
10 |
67% |
|
Mott Haven-Port Morris, BX* |
3,344 |
2 |
99% |
|
Sunset Park West, BK* |
2,071 |
2 |
100% |
|
Hunts Point, BX* |
1,777 |
7 |
100% |
|
Jamaica, QN* |
1,345 |
5 |
100% |
|
Hunters Point-Sunnyside-West Maspeth, QN |
976 |
2 |
47% |
|
Bensonhurst East, BK |
852 |
1 |
17% |
|
New Springville-Bloomfield-Travis, SI |
762 |
1 |
13% |
|
East Flatbush-Farragut, BK |
693 |
1 |
6% |
|
East New York, BK* |
692 |
2 |
100% |
*EJ Neighborhood
SOURCE: NYC Department of Sanitation, Annual Report on the Implementation of New York City’s Waste Equity Law, 2022.
Over 75 Percent of the City’s Solid Waste Stream is Processed in a Handful of Low- Income Communities of Color in North Brooklyn, the South Bronx, Sunset Park, and Southeast Queens.
This report’s analysis sums the average daily throughput of municipal solid waste (MSW) and construction and demolition debris (C&D) for transfer stations in the 13 communities targeted by Local Law 152 of 2018 (known as the “Waste Equity Law”), which required DSNY to reduce the capacity of transfer stations in community districts identified as unduly burdened by the city’s waste infrastructure. The five additional high-capacity residential MSW transfer stations operated by DSNY outside of the target community districts were also included in the analysis.
This analysis shows that the city’s solid waste is predominantly processed in EJ Neighborhoods. There is a greater proportion of Black, Hispanic or Latino, and Asian and Pacific Islander residents in these neighborhoods than the citywide average and a smaller proportion of white residents. The five neighborhoods with the greatest average daily throughput of solid waste are East Williamsburg, Mott Haven-Port Morris, Sunset Park, Hunts Point, and Jamaica, amounting to higher levels of heavy-duty sanitation vehicle traffic in these communities. Many of the neighborhoods with the greatest average daily solid waste throughput have the highest rates of pollution-attributable emergency department visits, namely Mott Haven- Port Morris and Hunts Point in the Bronx, East New York and East Williamsburg in Brooklyn, and Port Richmond on Staten Island’s North Shore, where rates of hospital emergency department visits attributable to O3 and PM2.5 for both adults and children can be as high as three times the citywide average.
Community Case Study
Microhaulers: Greenfeen Organix
LOCATION: Multiple
Microhaulers are small organic waste haulers who collect food scraps using bicycles or clean air vehicles. While traditional waste haulers typically use diesel trucks, which are among the most intensive mobile sources of air pollution, microhaulers help keep the air clean while they connect New Yorkers to composting. Under the City’s Commercial Waste Zones law, microhaulers under a certain size are exempt from commercial waste zone limitations because they do not produce air pollution, allowing them to expand their service areas without restrictions.270Commercial Waste Zones. (2019). DSNY. NYC Government.
GreenFeen OrganiX (GFO) is a woman-led, worker-owned cooperative compost service that provides microhauling and compost processing services in the Bronx and Upper Manhattan.271GreenFeen OrganiX. (n.d.). GreenFeen OrganiX. Community OrganizationGFO serves the Northwest Bronx, Upper
Manhattan, and Harlem, which include several neighborhoods home to low-income Black and Hispanic or Latino communities.272GreenFeen Organix Service Area. (n.d.). GreenFeen OrganiX. Community Organization.Many of these neighborhoods have above-average traffic density, which leads to elevated levels of mobile source air pollution.273Your Neighborhood’s Air Quality. (2022). NYC DOHMH. Environment and Health Data Portal. NYC Government.Microhaulers play an especially vital role in improving air quality in environmental justice communities. GFO alleviates air pollution by replacing diesel- powered waste hauling, reducing pests attracted to organic waste placed out on the street for collection, providing green jobs, and educating community members about environmental and waste justice.274GreenFeen OrganiX Testimony, New York City Business Integrity Commission: Hearing on Proposed Rules Governing Microhaulers. (2021). New York City Business Integrity Commission. NYC Government.GreenFeen OrganiX helps us imagine a future for New York City’s waste system centered on clean, safe hauling methods; green jobs; and sustainable waste processing methods such as composting.
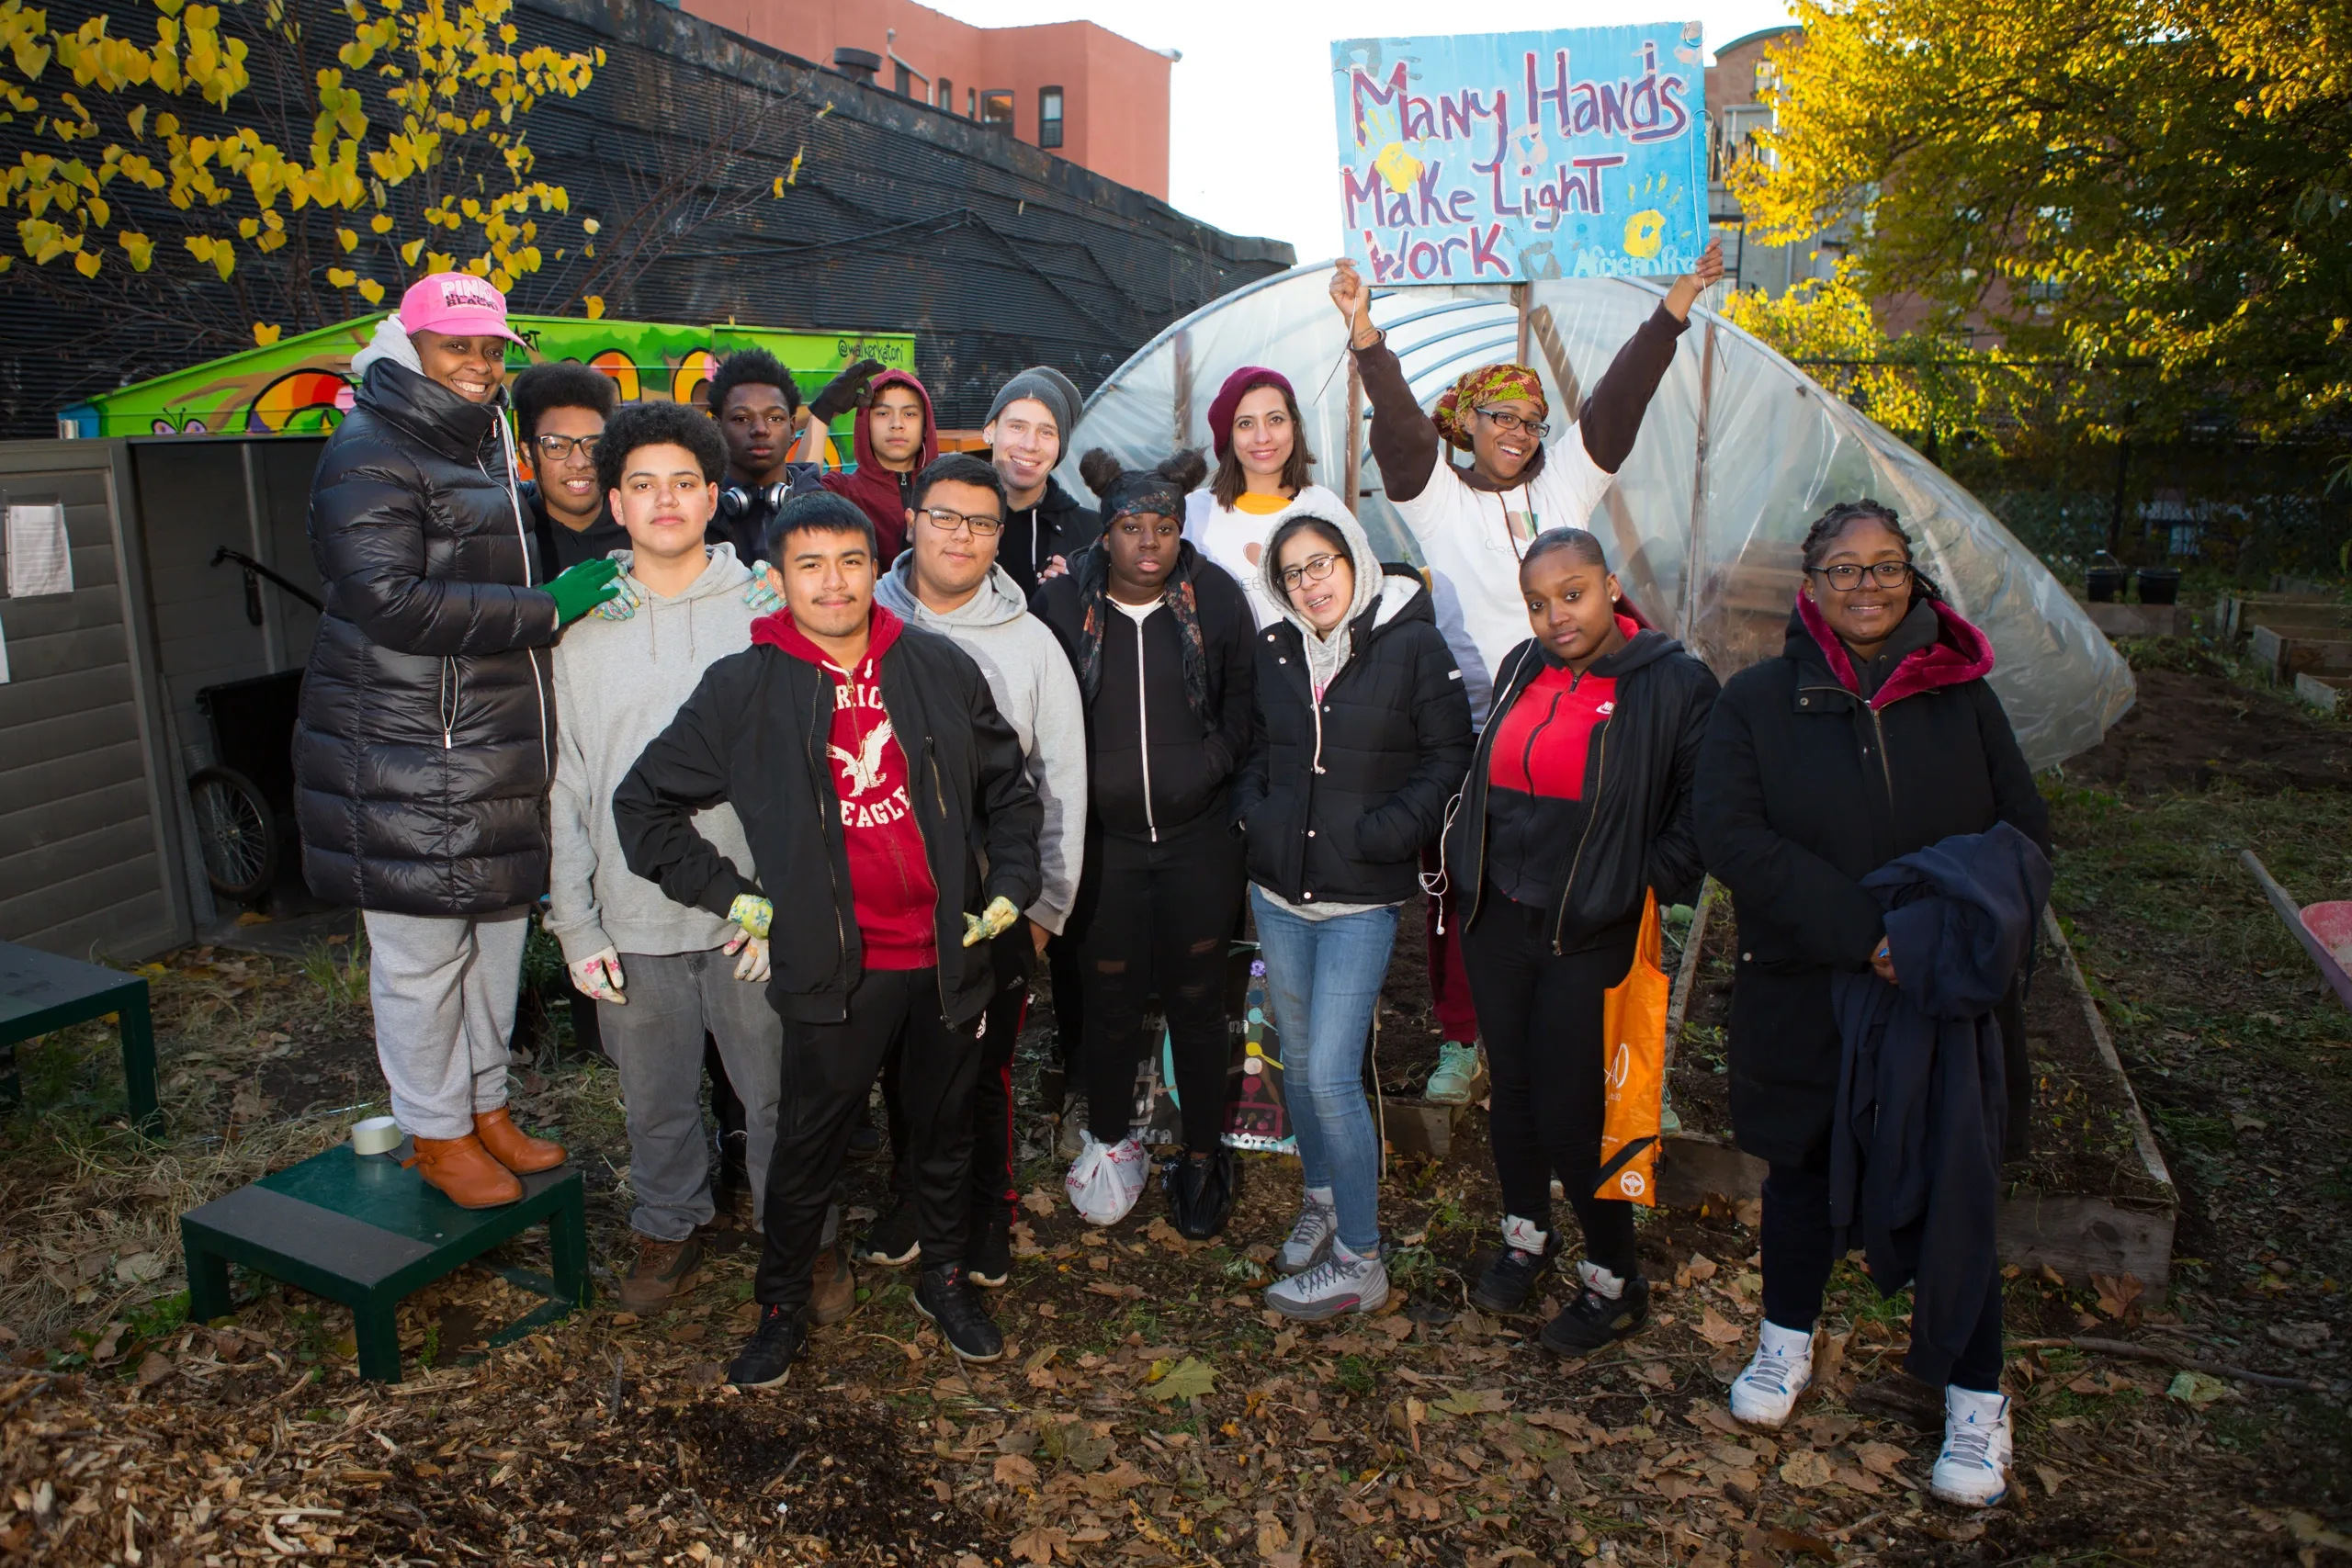
GreenFeen OrganiX
Indoor Air Quality
The quality of the air in homes, schools, and workplaces also affects human health. Indoor air quality has myriad contributing factors. The use of fossil-fuel burning equipment and appliances, such as stoves, results in high concentrations of nitrogen dioxide, particulate matter, and other pollutants in the home and has been linked to increased risk of asthma in children.268Indoor Air Pollution: the Link between Climate and Health. (2020). Seals, B. RMI. Nonprofit Organization. While fossil fuel-burning equipment and appliances are prevalent in both EJ and non-EJ Areas throughout New York City, this is expected to change over time as local laws regulating building emissions and other policies take effect and wealthier buildings and households have greater resources to convert gas appliances to electric.269PowerUp NYC. (2023). NYC MOCEJ. NYC Government.
Other contributors to poor indoor air quality include inadequate ventilation, which is more prevalent in the housing of low-income New Yorkers, inadequate housing maintenance, which can lead to home health hazards like pest infestation and mold growth, secondhand smoke, and dust from unsafe renovation or repair work, all of which are potential asthma triggers.. In addition to asthma, poor indoor air quality is associated with other negative health impacts like eye, nose, and throat irritation, headaches, dizziness, fatigue, cancer, heart disease, and other respiratory diseases.275Indoor Air Quality. (2023). US EPA. US Government. Poor ventilation, particularly, discussed at greater length in Access to Safe and Healthy Housing (p. 106), is common in low-income housing and can lead to a buildup of pollutants, as well as heat.276Introduction to Indoor Air Quality. (2023). US EPA. US Government.
Indoor air quality data collection is inherently challenging, as it requires access to residents’ homes. It is impossible to measure the impact that indoor air pollutants have on New Yorkers’ health without such data. This report’s analysis of indoor air quality is constrained by these data limitations. Existing data sources, including indoor air quality complaints and/or repair data at NYCHA campuses, do not directly measure air quality, but could help identify where there are concerns about the issue. To address this data gap, local community organizations such as WE ACT for Environmental Justice have conducted community monitoring programs, finding that appliances such as gas stoves contribute significantly to indoor NO2 and carbon monoxide levels in NYCHA homes.277Out of Gas, In with Justice. (2023). WE ACT for Environmental Justice. Community Organization. However, these issues are not limited to NYCHA homes, and much more data is needed to gain a more complete understanding of the impacts that indoor air quality has on New Yorkers.
Community Case Study
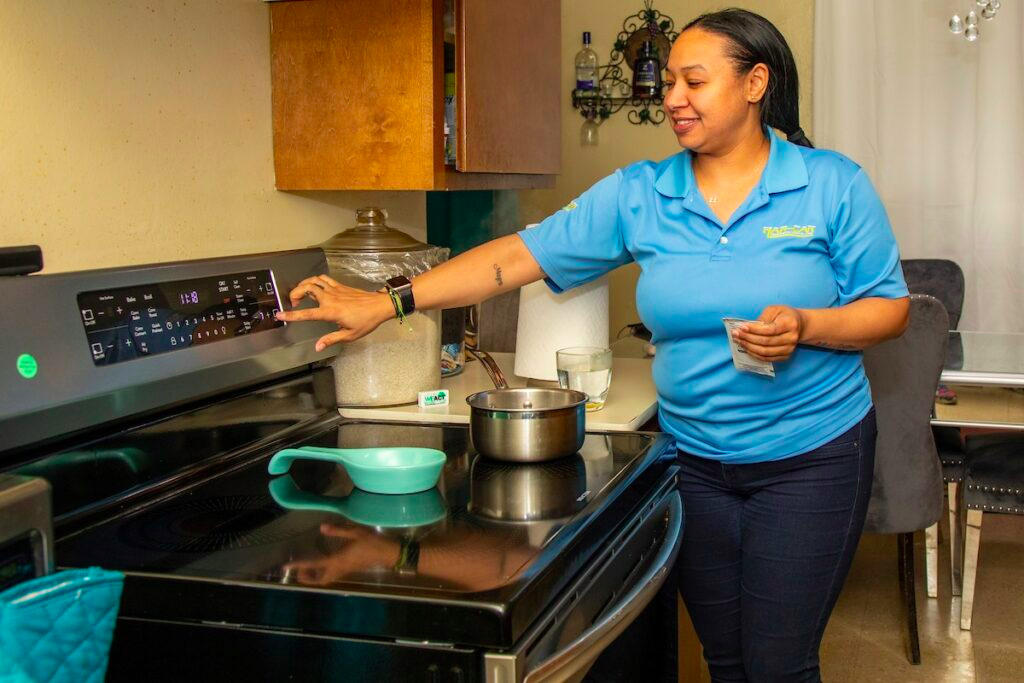
Out of Gas, in with Justice: We Act
LOCATION: Manhattan
Through the Out of Gas, In with Justice pilot project, the community-based organization WE ACT for Environmental Justice (WE ACT) is investigating the impacts of transitioning from gas to induction cooking in affordable housing. In partnership with Columbia University’s Mailman School of Public Health and Berkeley Air Monitoring, the pilot provided induction stoves to 10 households in NYCHA housing and measured subsequent effects on air quality. The study also compared those apartments’ air quality readings with those in other apartments that did not receive stoves and assessed participants’ reactions to induction stoves, as well as potential challenges relating to energy load in NYCHA buildings to understand how to implement these upgrades at a larger scale.278WE ACT 2022 February Membership Meeting: Getting Rid of Gas Stoves. (2022). WE ACT for Environmental Justice. Community Organization. Video.
The study found that over a 10-month monitoring period, households with induction stoves experienced a 35 percent reduction in daily NO2 concentrations compared to those using gas stoves, when controlling for temperature and apartment-level factors.279Out of Gas, In with Justice: Studying the Impacts of Induction Stoves on Indoor Air Quality in Affordable Housing. (2023). WE ACT for Environmental Justice. (2023). Community Organization.None of the households that received an induction stove requested their gas stove back at the end of the study.280Ibid.
Through this pilot, WE ACT hopes to illuminate the unique benefits and challenges of transitioning away from gas cooking in public housing. For example, transitioning to induction stoves reduces the likelihood of asthma in children. Citywide, 21 percent of public housing residents have asthma, compared to 11.5 percent of New York City residents that do not receive housing assistance.281Community Characteristics—Public housing or rental assistance by Asthma ever. (2017). NYC Health. Data Portal EpiQuery. NYC Government.As such, indoor air quality improvements are particularly important in public housing. The findings from the pilot study can inform efforts to help NYCHA residents access the health benefits of gas-free cooking at a larger scale.
Stakeholder Input
The following collection of quotes from the focus groups and interviews, conducted as part of the qualitative research for this report, speak to the myriad issues associated with air pollution.
Air Pollution
“Air pollution is the original sin. We see this with highways through our communities, like in Sunset Park. We see this through the use of dirty fuels for heat, polluting the atmosphere and causing dirty air, leading to staggering rates of asthma. And we see this with the locating of power plants and sewage treatment plants.”
Mobile Sources of Pollution
“I live between the George Washington Bridge and the Cross Bronx Expressway. There’s a lot of pollution that comes from that, unfortunately. And when COVID hit me and my family, it was really bad for all of us. Especially when it came with the coughing. Because…we’ve been exposed to so much pollution, it damages our lungs. And now my family and I have asthma, which shouldn’t be right. We’ve never had asthma and now our lungs are messed up.”
“[In the outer boroughs, residents are] more reliant on car transportation due to the lack of reliable public transit…As a result, there is more air pollution, smog, increased asthma, chronic respiratory issues, more noise, and less green space.”
“It’s incredible that we can have air quality alerts without any rapid efforts to protect air quality like restricting driving or other emitters.”
“We’re seeing these giant last-mile warehouses pop up in EJ communities… getting several truck and van trips a day, having a disproportionate impact on EJ communities around them.”
Solid Waste Facilities
“North Brooklyn was the most overburdened with the most waste transfer facilities, truck traffic, and waste collection. This community has higher rates of heart disease and cancer from exposure to pollution from decades of diesel fleets.”
“Waste is a problem…Trucking produce from outside the city into the city, wasting a third of it and then trucking it back out of the city is a problem.”
Indoor Air Pollution
“[We] need a data repository for data that relates to environmental and health conditions at NYCHA… The more information we have, the more we can take action.”
Next:Exposure to Toxic and Hazardous Materials >>