This section focuses on access to safe and healthy housing across six issues and indicators: housing affordability, health-related housing maintenance issues, public housing, utility access and affordability, lead in housing plumbing, and noise. Given the unique housing quality challenges and enforcement mechanisms for residents of New York City Housing Authority (NYCHA) buildings, public housing is discussed discretely. The findings point to opportunities for the City to invest in environmental justice communities. To learn more about what the City is doing to address housing affordability and fair housing issues, refer to Recent Housing Initiatives to Address Affordability and Fair Housing (p. 109).
A healthy home is fundamental to wellbeing, and disparities exist in housing quality indicators between EJ Areas and non-EJ Areas. Housing-related EJ issues must be contextualized within the affordability crisis, which is making it harder for New York City residents to find safe and affordable places to live. Generations of racist housing policies and lending practices contributed to uneven access to homeownership, affordable rental opportunities, and intergenerational wealth.333, 334 As discussed previously in Access to Resources (p. 52), redlining and other historic policies and practices contributed to there being more housing for low-income households and people of color in areas with more environmental burdens. As such, outdoor air quality issues often translate into indoor air quality issues in the home.335 Given the association between environmental burdens and older, poorly maintained housing, environmental improvements, and remediation are sometimes met with community concerns about ”environmental gentrification.” 336
Key Findings
![]()
![]()
Energy efficient new construction and energy retrofits have significant potential to reduce energy burden for residents and improve housing quality and associated health outcomes.
9
out of
10
neighborhoods with the highest incidents of three or more maintenance deficiencies in renter households are EJ Neighborhoods.
![]()
![]()
A lack of available affordable housing options may lead to occupation of substandard and informal housing units, which present health and climate risks. Informal housing units are by definition not compliant with New York City’s housing code and therefore present housing quality issues and risks. Informal basement apartments in particular face risks in the form of flooding, carbon monoxide poisoning, insufficient light and ventilation, and inadequate egress in the event of a fire.337, 338ENDNOTECOPY
Limited access to affordable housing can also lead to an increase in the population experiencing homelessness, as well as an increase in overcrowding in housing units. Overcrowding was an accelerant for the spread of COVID-19, leading to a higher rate of cases in neighborhoods with severe overcrowding.339Association between overcrowded households, multigenerational households, and COVID-19: a cohort study (2021). Ghosh, A.K., et al. Academic Research. Overcrowding may also increase mental stress in the form of psychological distress, drug and alcohol abuse, feeling depressed, and feeling unhappy about one’s health.340WHO Housing and Health Guidelines (2018). World Health Organization. Academic Research.
Many health-related housing maintenance issues are often associated with older and less energy- efficient buildings, while modern, energy-efficient buildings with mechanical ventilation tend to offer better indoor air quality, including lower indoor concentrations of particulate matter, carbon dioxide, and volatile organic compounds, lower fluctuations in temperature and humidity year-round, and lower risk of allergic symptoms in children.341Effects of Mechanical Ventilation on Indoor Air Quality and Occupant Health Status in Energy-efficient Homes: A Longitudinal Field Study. (2021). Lim, A., Yoon, M., Kim, E., Kim, H., Ju Lee, M., and Cheong, H. Science of the Total Environment, 785. Academic Research. Energy efficiency retrofits can improve ventilation and incorporate building envelope upgrades that reduce noise (in addition to their thermal insulative qualities). Energy- efficient buildings also have lower utility bills when compared to poorly insulated and ventilated buildings.342Pathways to Carbon-Neutral NYC. (2021). NYC MOCEJ. NYC Government. As multi-family buildings undergo these upgrades, it is important that tenants are protected from cost-shifting leading to rent increases that further displaces low and middle- income residents.
It is also important to design and retrofit housing with consideration of the needs of residents with disabilities. Residents with disabilities, particularly those with mobility impairments, may have limited options in finding affordable housing that is accessible to their needs. Housing designed for accessibility allows differently abled residents to stay in their units longer and reduces the chance of in-home injury.343Accessible Design Features and Home Modifications to Improve Physical Housing Accessibility: A Mixed-Methods Survey of Occupational Therapists (2022). C. Wellecke, et al. Disability and Health Journal, 15(3). Academic Research.
Neither the city’s drinking water nor the city’s distribution pipes contain lead. However, some privately owned water pipes connecting buildings to city distribution pipes and within private buildings still contain lead. Exposure to lead from these sources varies across New York City neighborhoods.
New York City’s drinking water supply comes from portions of the Hudson Valley and Catskill Mountains through a system of reservoirs and controlled lakes as far as 125 miles north of the city. New York City operates the largest unfiltered water system in the nation. The NYC Department of Environmental Protection (DEP) manages efforts to protect the city’s source waters upstate and make the system more sustainable and resilient in the face of climate change. Since 1997, an annual average of $100 million was spent to support DEP’s watershed protection efforts.344Review of the New York City Watershed Protection Program (2020). National Academies of Sciences, Engineering, and Medicine. Academic Research.
Environmental issues in the home need to be addressed with the same rigor as issues outside the home to ensure that New York residents have a safe, healthy, and affordable place to call home. As climate change continues to threaten homes through increased temperatures and flood events, it is crucial to make resiliency and sustainability upgrades in new and existing buildings. The climate change risks that affect housing are discussed further in Exposure to Climate Change (p. 140).
Recent Housing Initiatives to Address Affordability and Fair Housing
In 2023, Mayor Adams announced a suite of housing policy proposals under the umbrella City of Yes for Housing Opportunity to address the affordable housing crisis. With a goal of creating an additional 100,000 homes over 15 years, City of Yes includes measures to increase the overall supply of housing units citywide. These measures include eliminating parking mandates and bans on apartments across the city, creating more affordable and supportive housing, enabling conversions of empty office buildings into housing units, allowing the construction of accessory dwelling units, and more. If adopted, City of Yes intends to ease the affordability crisis by providing more homes for New York City residents.
In 2020, the City released Where We Live NYC, the City’s first comprehensive fair housing plan, to confront segregation and take action to advance opportunity for all New Yorkers. Based on the findings from data analysis and extensive engagement with housing insecure New Yorkers, Where We Live NYC advances policies and programs to combat housing discrimination against protected classes, provide down payment assistance for low-income homebuyers, fund home repairs for low- and moderate-income homeowners, provide more resources for tenants experiencing harassment and displacement, create the New York City Public Housing Preservation Trust to fund repairs for NYCHA apartments, and much more.
Taken together, these two major housing initiatives can ease the affordability crisis and help all residents find and maintain safe and healthy homes.
Data Analysis
Housing Affordability
The housing affordability crisis does not equally impact demographic groups in New York City. According to Where We Live NYC, the City’s fair housing plan, Hispanic or Latino New Yorkers have the lowest rates of homeownership (17 percent), followed by Black New Yorkers (28 percent), compared to the City’s overall homeownership rate of 32 percent.345Where We Live Plan. (2019). NYC HPD and NYCHA. NYC Government. Rent burden, calculated as households spending more than 30 percent of their income on housing, affects Asian and Pacific Islander populations the most in New York City (50 percent), followed by Hispanic or Latino renters (44 percent), white renters (41 percent) and Black renters (37 percent).346ENDNOTECOPY There is a comparatively low rate of rent burden for Black households, who comprise forty-five percent of public housing residents. Households living in public housing or utilizing housing vouchers benefit from public subsidies that limit rent burden. Immigrant renters are disproportionately rent burdened (50 percent) compared to non-immigrant renters (41 percent).347ENDNOTECOPY
A lack of sufficient affordable housing also creates conditions that lead to homelessness. In fiscal year 2023, the average daily population of homeless individuals in New York City Department of Homeless Services shelters was approximately 60,000, including 20,000 children.348Data Dashboard Chart. (2023). NYC DHS. NYC Government. Approximately 97 percent of the overall population of homeless individuals were people of color.349ENDNOTECOPY
Reported Maintenance Deficiencies in NYC Renter Households
This chart displays the number of reported maintenance deficiencies by race of householder from the 2017 New York City Housing and Vacancy Survey (HVS). Maintenance deficiencies include additional heating required in winter; heating breakdown; cracks or holes in interior walls, ceilings, or floors; presence of rodents; presence of broken plaster or peeling paint; toilet breakdown; water leakage into unit.

SOURCE: NYC Department of Housing Preservation and Development, NYC Housing and Vacancy Survey, 2017.
Health-related Housing Maintenance Issues
Homes with multiple maintenance issues such as mold, peeling paint, and inadequate heating during winter months can negatively impact health. These types of conditions are more likely to occur in high- poverty neighborhoods and disproportionately impact Black and Hispanic or Latino families that rent their homes.350Affording Housing at the Expense of Health: Exploring the Housing and Neighborhood Strategies of Poor Families (2014). Diana Hernandez. Journal of Family Issues, 37(7). Academic Research.
Asthma is a primary health issue that may be caused or exacerbated by maintenance issues in the home and is often compounded by poor outdoor air quality. Data from the 2017 Housing Vacancy Survey indicates that Black and Hispanic or Latino households were overrepresented among renter households reporting three or more maintenance deficiencies in the home. Thirty-two percent of households reporting three or more deficiencies were Black, and 40 percent were Hispanic or Latino, even though those populations comprise only 22 percent and 29 percent of the citywide renter population, respectively. The Department of Health and Mental Hygiene (DOHMH) found that even when controlling for income, Black and Hispanic or Latino people are still more likely to live in buildings with serious maintenance issues, further suggesting that systemic racism is behind these disparities.351Health, Housing, and History. (2021). NYC DOHMH. NYC Government.
Geographically, the neighborhoods with the highest incidence of renter households reporting three or more maintenance deficiencies are in the Bronx, Central Brooklyn, and Upper Manhattan. Each of the top 10 neighborhoods is an EJ Neighborhood, except Riverdale-Kingsbridge, where 49 percent of census tracts are designated as EJ Areas. One data limitation is that housing maintenance issues may go unreported, especially when there are language barriers, undocumented residents, or fears of landlord retaliation.
Top 10 Neighborhoods with the Highest Incidence of Three or More Reported Maintenance Deficiencies in Renter Households
| NEIGHBORHOOD (SUB-BOROUGH AREA) | PERCENT OF RENTER HOUSEHOLDS REPORTING ≥3 MAINTENANCE DEFICIENCIES | PERCENTAGE OF CENSUS TRACTS CLASSIFIED AS AN EJ AREA |
|---|---|---|
|
University Heights-Fordham, BX* |
32% |
100% |
|
Brownsville-Ocean Hill, BK* |
29% |
100% |
|
Kingsbridge Heights-Mosholu, BX* |
29% |
98% |
|
North Crown Heights-Prospect Heights, BK* |
25% |
69% |
|
Riverdale-Kingsbridge, BX |
24% |
49% |
|
Mott Haven-Hunts Point, BX* |
24% |
100% |
|
Bedford-Stuyvesant, BK* |
23% |
92% |
|
Morningside Heights-Hamilton Heights, MN* |
22% |
89% |
|
Highbridge-South Concourse, BX* |
22% |
100% |
|
Morrisania-Belmont, BX* |
21% |
98% |
*EJ Neighborhood
SOURCE: NYC Department of Housing Preservation and Development, NYC Housing and Vacancy Survey, 2017.
HPD inspectors work tirelessly to keep tenants safe and hold building owners accountable, performing over 500,000 inspections annually.
Program/Policy Spotlight
Alternative Enforcement Program (aep)
LEAD AGENCY: NYC Department of Housing Preservation and Development (HPD)
The Alternative Enforcement Program (AEP) is a compliance enforcement program for apartment buildings with many housing maintenance code violations. The program aims to improve housing conditions by performing frequent inspections to monitor reported violations, issue Orders to Correct if the owner fails to act and make repairs and replace building systems where necessary. Buildings not discharged within the first four months of initial notice from HPD are subject to fees and liable for the cost of any repairs undertaken by HPD. Established in 2007, the program has conducted 15 rounds of selection and enforcement, with 200 buildings selected annually in the first seven years. As of 2015, the program selects 250 of the worst-offending buildings for enforcement each year.352Alternative Enforcement Program, Year 13 Report. (2020). NYC HPD. NYC Government.
The criteria for a building to be selected for the AEP are twofold. First, depending on the building size, it must meet a set ratio of housing violations per dwelling unit over a five-year lookback period. Buildings with 15 or more units must have a ratio of three or more open violations, while buildings with 3 -15 units must have a ratio of five or more open violations. Second, the building must have incurred up to $2,500 (for buildings with 15 units or more) or $5,000 (for buildings under 15 units) in charges from HPD’s Emergency Repair Program within the five-year lookback period. 353ENDNOTECOPYEmergency Repair Program (ERP) fees are charged to a building when HPD is forced to take direct action to correct code violations related to heat, hot water, water leaks, mold and other hazardous materials. Upon selection for the AEP, building owners are required to notify tenants by posting a conspicuous sign within 15 days of the notice and they have up to four months to correct the poor housing conditions before HPD steps in to perform the corrective measures itself.354Code Enforcement. (n.d.). NYC HPD. NYC Government.
This building selection and enforcement framework has strengths and weaknesses. The five-year look back period allows the program to capture buildings with housing violations beyond the current year of review. The use of two violation indicators limits the number of buildings selected for the program and ensures the availability of program resources for enforcement and repairs in the worst-performing buildings.
The program limits the number of buildings with fewer than six units included in the annual selection to 25 buildings (10 percent of the selection list). This limit notwithstanding, a program report stated that 3-5 unit buildings made up 22 percent of the program’s $4.1 million expenditure from 2016 to 2019.355Alternative Enforcement Program, Year 13 Report. (2020). NYC HPD. NYC Government.Also, an analysis of the length of time it takes for selected buildings to correct necessary violations and be discharged from the program showed that from 2007 to 2019, an average of 62 percent of buildings with over 20 units were discharged within the first four months compared to 16 percent of 3-5 unit buildings.356ENDNOTECOPYThese findings point to a significant need of assistance needs for small properties whose landlords often face greater financial challenges and lack the housing management resources needed to address violations and pay HPD fees. Analysis of small buildings (under 6 units) with violations showed that 55 percent are in EJ Areas.
Thus, while the inclusion limit on smaller properties leaves some landlords without incentives to address code violations, AEP is primarily punitive in nature and additional fines on small property owners may further push them into debt without achieving compliance. Furthermore, immediately hazardous conditions may be corrected through the ERP regardless of whether a building has been selected for AEP. Program reports have acknowledged limitations related to housing quality enforcement for smaller properties and have included recommendations to extend the initial compliance period for selected small buildings to avoid additional penalties.357Alternative Enforcement Program, Year 13 Report. (2020). NYC HPD. NYC Government.Other HPD programs like HomeFix and the Homeowner Help Desk have also been promoted to help finance repairs and drive housing quality improvements in smaller residential properties.
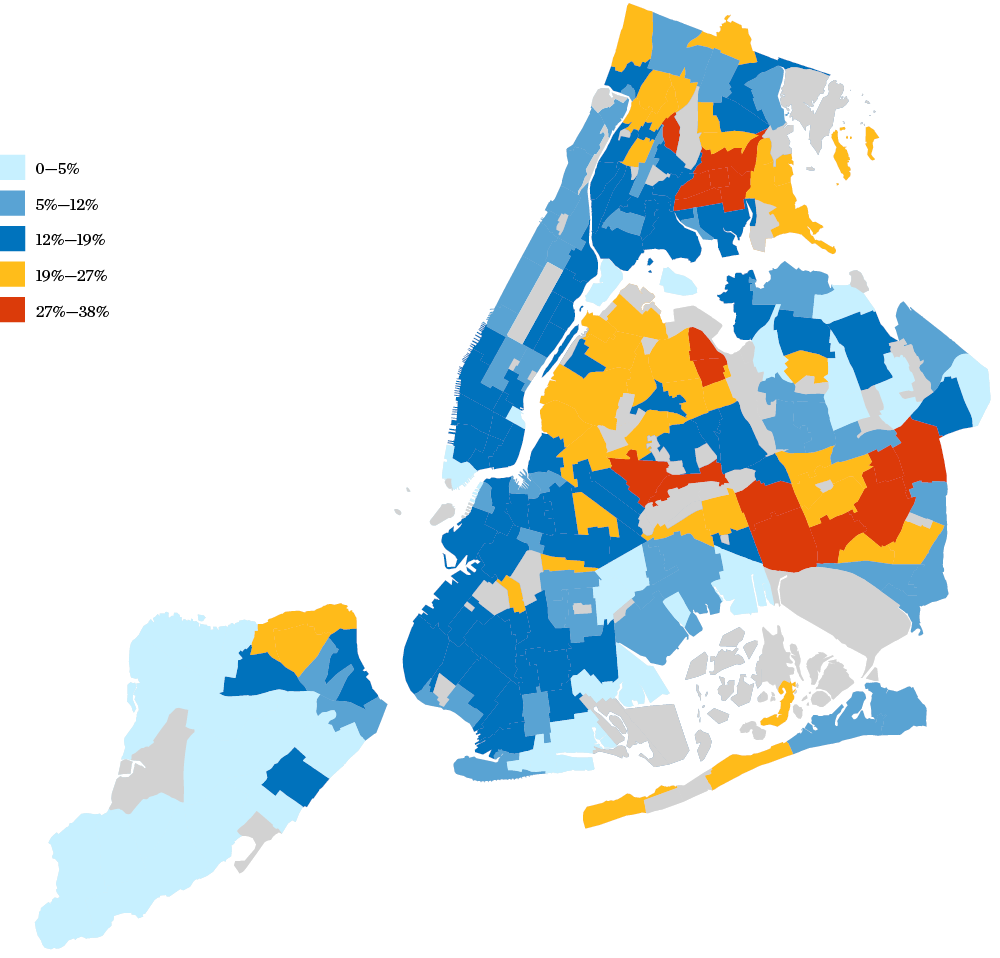
Reported Maintenance Deficiencies in Renter Households
Areas with the highest incidence of maintenance deficiencies are defined as areas with the top 25 percent of renter households who report three or more maintenance deficiencies.
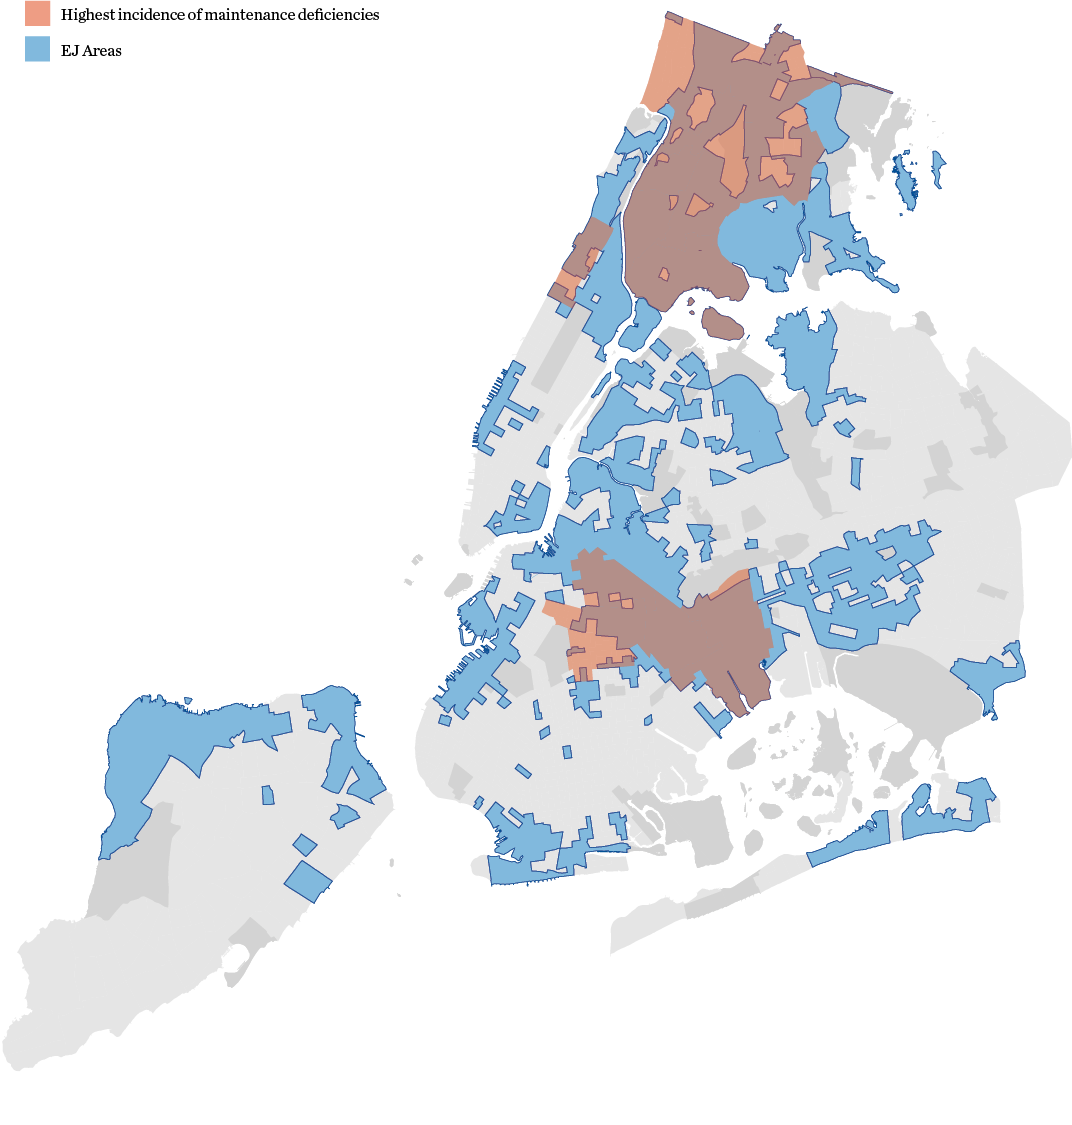
SOURCE: New York City Department of Housing Preservation and Development, NYC Housing and Vacancy Survey, 2017. NYS Department of Environmental Conservation, Disadvantaged Communities Criteria, 2023.
Top 10 Neighborhoods with the Highest Incidence of Lead Paint Violations
| NEIGHBORHOOD (NTA) | NUMBER OF LEAD PAINT VIOLATIONS | LEAD PAINT VIOLATIONS NORMALIZED BY POPULATION | PERCENTAGE OF CENSUS TRACTS CLASSIFIED AS AN EJ AREA |
|---|---|---|---|
|
Erasmus, BK* |
261 |
0.93% |
72% |
|
Kingsbridge Heights, BX* |
324 |
0.93% |
94% |
|
Fordham South, BX* |
227 |
0.78% |
100% |
|
Belmont, BX* |
217 |
0.76% |
87% |
|
Mount Hope, BX* |
420 |
0.75% |
100% |
|
West Concourse, BX* |
299 |
0.72% |
100% |
|
Bedford Park-Fordham North, BX* |
413 |
0.69% |
100% |
|
Crown Heights South, BK |
273 |
0.67% |
14% |
|
Flatbush, BK |
718 |
0.67% |
18% |
|
Prospect Lefferts Gardens-Wingate, BK |
462 |
0.66% |
21% |
*EJ Neighborhood
SOURCE: NYC Department of Housing Preservation and Development, Code Violations, 2023.
Lead poisoning, particularly among young children and pregnant people, is a major health-related housing issue. Lead exposure can cause learning and behavior problems in children, high blood pressure and miscarriage in pregnant people, as well as brain, kidney and reproductive issues in adults.358Lead Poisoning. (2023). NYC DOHMH. NYC Government. Lead can also be present in tap water, which is discussed in Exposure to Polluted Water (p. 128). Homes built before the 1960 citywide lead paint ban, are 69-87 percent more likely to contain lead paint or dust.359</span >
Lead paint violations issued by HPD are disproportionately located in EJ Areas. In 2022, seven of the top ten neighborhoods with lead paint violations normalized by population were EJ Neighborhoods located in the Bronx. Key data limitations include that lead paint violations focus only on multi-family private housing and complaints and inspections are not uniform across the city.
Maintenance of cooling towers in buildings is crucial to prevent the spread of Legionnaires’ Disease, a type of pneumonia caused by bacteria growing in warm water. Legionnaires’ is especially risky for older adults, smokers, and those with compromised immune systems or chronic lung disease.360Legionnaires Disease. (2022). NYC DOHMH. NYC Government. From 2019-2022, the top ten neighborhoods with the highest annual, age-adjusted rates of Legionnaires’ Disease are all EJ Neighborhoods in the Bronx and Upper Manhattan.361ENDNOTECOPY During that period, outbreaks occurred in Highbridge and Central Harlem North- Polo Grounds.
Public Housing
Public housing in New York City is operated by the New York City Housing Authority (NYCHA). Due to decades of underinvestment at the State and federal level, conditions at many NYCHA buildings have deteriorated and have acute maintenance issues that affect human health. NYCHA developments, which house 1 in 17 New Yorkers, have a backlog of major repairs approximated at $78 billion in 2023.362NYCHA Physical Needs Assessment (2023). NYCHA. NYC Government. 74 percent (or $57.8 billion) of the total physical needs consist of plumbing, building exteriors, heating systems, and apartment repairs. A range of grounds improvements as well as building systems and components constitute the other 26 percent.363ENDNOTECOPY
Top 10 Neighborhoods with the Highest Incidence of Legionnaires’ Disease
| NEIGHBORHOOD (NTA) | AVERAGE LEGIONNAIRES’ DISEASE ANNUAL COUNT, 2019-2022 | AVERAGE ANNUAL LEGIONNAIRES’ DISEASE AGE- ADJUSTED RATE PER 100,000 PEOPLE, 2019-2022 | PERCENTAGE OF CENSUS TRACTS CLASSIFIED AS AN EJ AREA |
|---|---|---|---|
|
Highbridge, BX* |
8 |
21.5 |
100% |
|
Van Cortlandt Village, BX* |
8 |
14.0 |
86% |
|
West Concourse, BX* |
5 |
13.7 |
100% |
|
Fordham South, BX* |
3 |
13.7 |
100% |
|
Central Harlem North-Polo Grounds, MN* |
11 |
12.0 |
97% |
|
Crotona Park East, BX* |
3 |
11.2 |
100% |
|
Norwood, BX* |
4 |
11.0 |
100% |
|
Kingsbridge Heights, BX* |
4 |
10.9 |
94% |
|
Bedford Park-Fordham North, BX* |
6 |
10.8 |
100% |
|
Longwood, BX* |
3 |
10.8 |
100% |
*EJ Neighborhood
SOURCE: NYC Department of Health and Mental Hygiene, 2022.
According to Where We Live NYC, public housing residents reported the highest prevalence of low-quality housing in 2017, with 37 percent of residents reporting three or more maintenance problems in their homes. 364Where We Live NYC (2019). NYC HPD and NYCHA. NYC Since then, NYCHA has implemented several organizational changes such as Work Order Reform and the Neighborhood Model that have ramped up staffing, improved the work order planning and scheduling, improved communication with residents through email and text notifications, and increased worker accountability and productivity through constant monitoring.
In 2019, NYCHA and the City signed an Agreement with the U.S. Department of Housing and Urban Development with the goal of remedying the deficient physical conditions in NYCHA properties to benefit residents across the city. The Agreement sets objectives to make improvements in seven high-priority areas: lead-based paint, mold, heat, elevators, inspections, pests, and waste management. The HUD Agreement established a framework by which NYCHA will continue to evaluate and progress towards compliance with federal requirements. Information on the progress made to date towards compliance with the HUD Agreement’s requirements is available online.365Draft PHA Annual Plan: Annual Agency Plan for Fiscal Year 2024. (2023). US HUD and NYCHA. US Government and NYC Goverment. An independent monitor was appointed under the HUD Agreement with access to NYCHA information and personnel and the monitor has issued and will continue to issue quarterly reports on NYCHA’s compliance with the HUD Agreement.366NYCHA Monitor. (2023). NYC Government.
Program/Policy Spotlight
Nycha Customer Contact
LEAD AGENCY: NYC Housing Authority (NYCHA)
NYCHA’s Customer Contact Center (CCC) is the system used by NYCHA tenants to raise housing complaints, report emergencies, and schedule routine maintenance repairs. The CCC also assists members of the public who have applied for or are seeking information on the public housing application process, as well as Section 8 tenants, and voucher holders.
The CCC allows two modes of communication: in-person at the CCC Walk-In locations, and via phone through the Call Center. There are two CCC Walk-In locations that primarily serve Section 8 and public housing applicants and NYCHA’s Section 8 voucher holders. In 2022, the Customer Contact Centers handled an average of 9,043 daily calls and 397 daily walk- ins. In addition to the Customer Contact Center, residents can create, schedule, and manage work tickets through MyNYCHA, a website and mobile app. They can also use it to subscribe to alerts for outages in their developments, view inspection appointments, view closed work tickets, and pay rent.
The Maintenance Unit of the CCC manages all aspects of public housing residents’ concerns, focusing mainly on apartment repair complaints and public space concerns. Complaints are forwarded to the affected Development as Service Requests to generate work orders. The Maintenance Unit of the CCC focuses mainly on apartment repair complaints and public space concerns such as mold and mildew concerns, problems with heat and hot water, and major service outages. The complaint process also includes immediate escalation of emergency situations which present a danger to life or limb. Such emergency situations are called in to the Development staff.
In 2019, an independent monitor was appointed under the HUD Agreement with access to NYCHA information and personnel.367ENDNOTECOPYIn the first quarterly report published by the independent monitor, it was stated that residents had to make repeated calls to development staff to get repairs done in a timely manner and sometimes, emergency work orders went unaddressed for weeks, with these lapses in property management tied to understaffing and a lack of staff training and supervision.368Monitor’s First Quarterly Report for the New York City Housing Authority. (2019). NYCHA Monitor. NYC Government.In response to these issues and the HUD Agreement to improve housing conditions, NYCHA has implemented operational changes to meet its performance targets. In the past year, the average time to complete emergency work orders was 22 hours, meeting the agency’s target of less than 24 hours.369NYCHA Preliminary Mayor’s Management Report. (2023). NYCHA. NYC Government.On average, 78 percent of emergency work orders were completed within 24 hours.370Emergency Work Orders – Public Housing Charts, NYCHA Metrics. (n.d.). NYCHA. NYC GovernmentHowever, in 2022, the average time to complete non- emergency work orders was 49 days, compared to a target of 15 days.371ENDNOTECOPY
In 2022, NYCHA completed 70,930 apartment inspections with only three percent of scheduled inspections never attempted and an additional 5 percent attempted but not completed due to no access. This is a significant improvement from 2019 which had 14 percent of scheduled inspections never attempted and an additional 15 percent attempted but not completed.372NYCHA Annual Inspection Action Plan, 2020. (2020). NYCHA. NYC Government.
While these operational changes and service improvements are very welcome by NYCHA residents, there is still much work to be done. Qualitative stakeholder input gathered as part of this study highlighted that lack of real-time communication and unpaid labor required from tenants to meet housing quality needs are barriers to environmental justice in NYCHA campuses.
The vast majority of NYCHA buildings are located within EJ Areas. Many NYCHA buildings are also located within coastal flood zones and high-heat vulnerability areas, making them particularly at risk of climate change impacts and displacement. The homes of 60,000 NYCHA residents across thirty-five developments suffered significant storm damage during Superstorm Sandy, and eleven years after the storm over $2.8 billion has been invested.373Interactive Sandy Transparency Map. (2022). NYCHA. NYC Government. As of Hurricane Season 2023, 21 developments with over 11,000 units are mitigated from storm surge damage and have full back-up power generators in place.
Utility Access and Affordability
An environmental justice analysis of housing quality must include a discussion of utility access and utility affordability. Utility rate increases, extreme heat brought on by climate change, blackouts, and the digital divide are all related to access and affordability.
Energy burden, or utility burden, is the extent to which paying utility bills burdens a household. The New York Public Service Commission (PSC) has adopted a target of limiting energy costs for low-income New Yorkers to no more than 6 percent of their pre-tax income.374Fact Sheet for Utility Consumers. (2022). NYS Public Service Commission. NYS Government. In New York City, a household is considered energy burdened if it spends more than 6 percent of its pre-tax income on utilities, including heat, hot water, and electricity.375How High Are Household Energy Burdens? (2020). American Council for an Energy-Efficient Economy. Research Organization., 376Understanding and Alleviating Energy Cost Burden in New York City (2019). NYC Mayor’s Office of Sustainability and NYC Mayor’s Office for Economic Opportunity. NYC Government. In New York City, responsibility for utility bills depends on tenure (rent vs. own) and many landlords pay for heat, water, or all utilities in master-metered buildings.
Internet is not included in standard energy burden calculations but is increasingly considered a standard utility. In New York City, the population average percent of households without access to the internet (home or cellular) in EJ Areas is 24 percent.377ENDNOTECOPY In non-EJ Areas only 13 percent of households do not have access to internet. Disparities in internet access create a “digital divide,” making it more difficult for residents without internet to access resources that are increasingly online.
Top 10 Neighborhoods with the Most Utility Burdened Households
| NEIGHBORHOOD (PUMA EXPRESSED AS CD) | PERCENT OF UTILITY BURDENED HOUSEHOLDS | PERCENTAGE OF CENSUS TRACTS CLASSIFIED AS AN EJ AREA |
|---|---|---|
|
Bedford Park-Fordham North-Norwood (BX CD-7)* |
38% |
98% |
|
Belmont-Crotona Park East-East Tremont (BX CD-3 and BX CD-6)* |
37% |
98% |
|
Hunts Point-Longwood-Melrose (BX CD-1 and BX CD-2)* |
37% |
100% |
|
Morris Heights-Fordham South-Mount Hope (BX CD-5)* |
37% |
100% |
|
Concourse-Highbridge-Mount Eden (BX CD-4)* |
36% |
100% |
|
Brownsville-Ocean Hill (BK CD-16)* |
34% |
100% |
|
Wakefield-Williamsbridge-Woodlawn (BX CD-12)* |
34% |
71% |
|
East Flatbush-Farragut-Rugby (BK CD-17) |
32% |
42% |
|
Borough Park-Kensington-Ocean Parkway (BK CD-12) |
31% |
2% |
|
Jamaica-Hollis-St. Albans (QN CD-12) |
30% |
44% |
*EJ Neighborhood
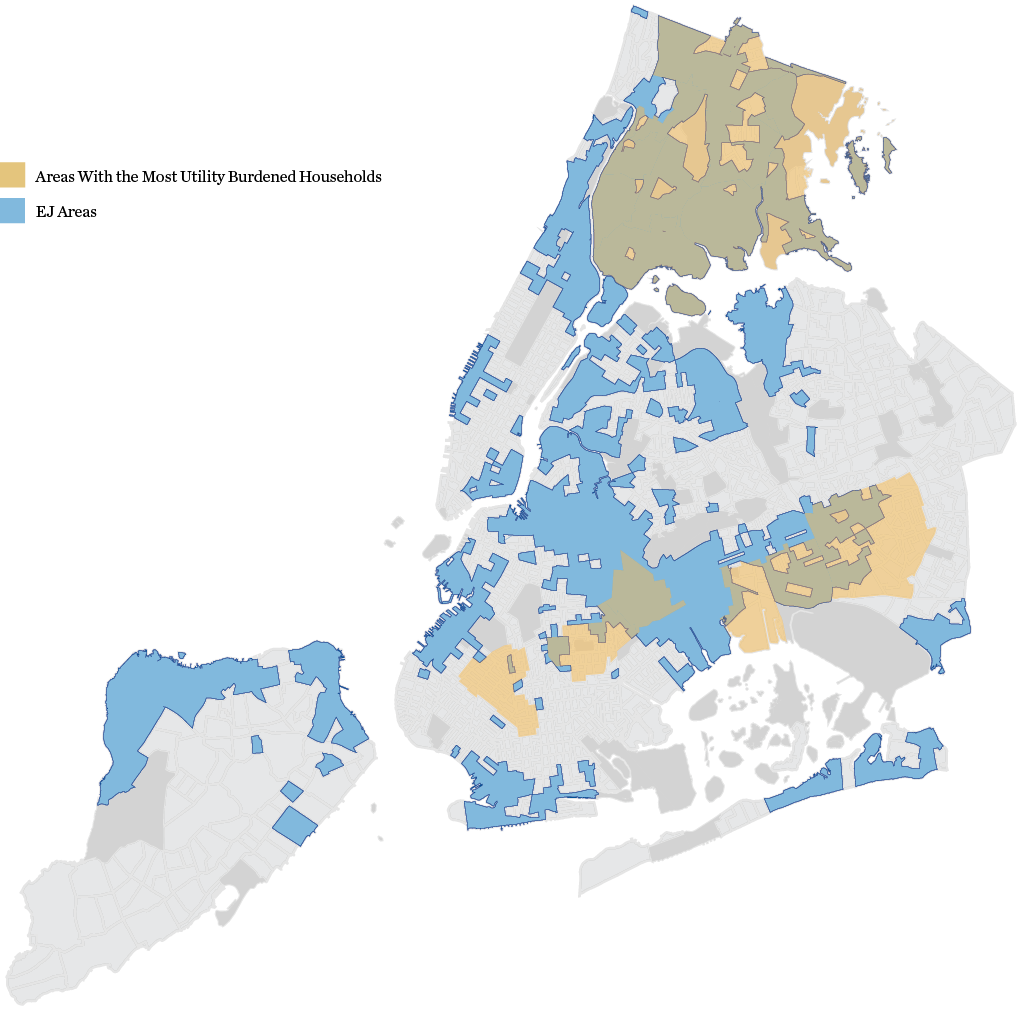
SOURCE: US Census Bureau, American Community Survey, 2017-2021 5-Year Estimates. NYC Mayor’s Office of Economic Opportunity.
Utility Burdened Households
Most utility burdened is defined as the top 25 percent of American Community Survey Public Use Microdata Areas (PUMAs) with the greatest proportion of households that are utility burdened.
Demographics of Neighborhoods with the Most Utility Burdened Households
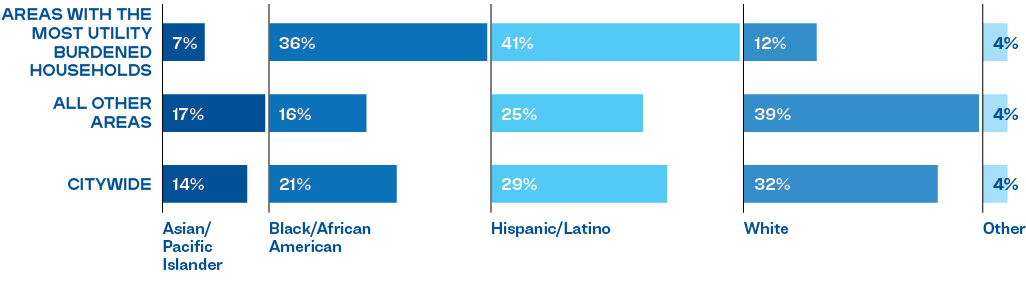
SOURCE: US Census Bureau, American Community Survey, 2017-2021 5 Year Estimates. NYC Mayor’s Office of Economic Opportunity.
Community Case Study
Sunset Park Solar
LOCATION: Sunset Park, Brooklyn
Sunset Park Solar is a community-led solar project that is owned and operated by a partnership between local justice organization UPROSE and its partners. Scheduled to launch in 2024, the project will manage an approximately 685-kilowatt (kW) solar array on the roof of the Brooklyn Army Terminal in collaboration with the New York City Economic Development Corporation (NYCEDC). Sunset Park Solar will allow renters, homeowners, and businesses in Sunset Park to participate in bringing more renewable generation into the New York City grid. Subscribers will be allocated a portion of the solar power generation to offset their energy bill. The energy billing process is coordinated with Con Edison, and subscribers can anticipate a discount of up to 25 percent on their electricity costs. Beyond its environmental benefits in reducing greenhouse gas emissions, Sunset Park Solar also alleviates energy burdens and shields low-income households from energy price fluctuations. The project partners plan to enter into a lease agreement and commence the array installation in 2024.
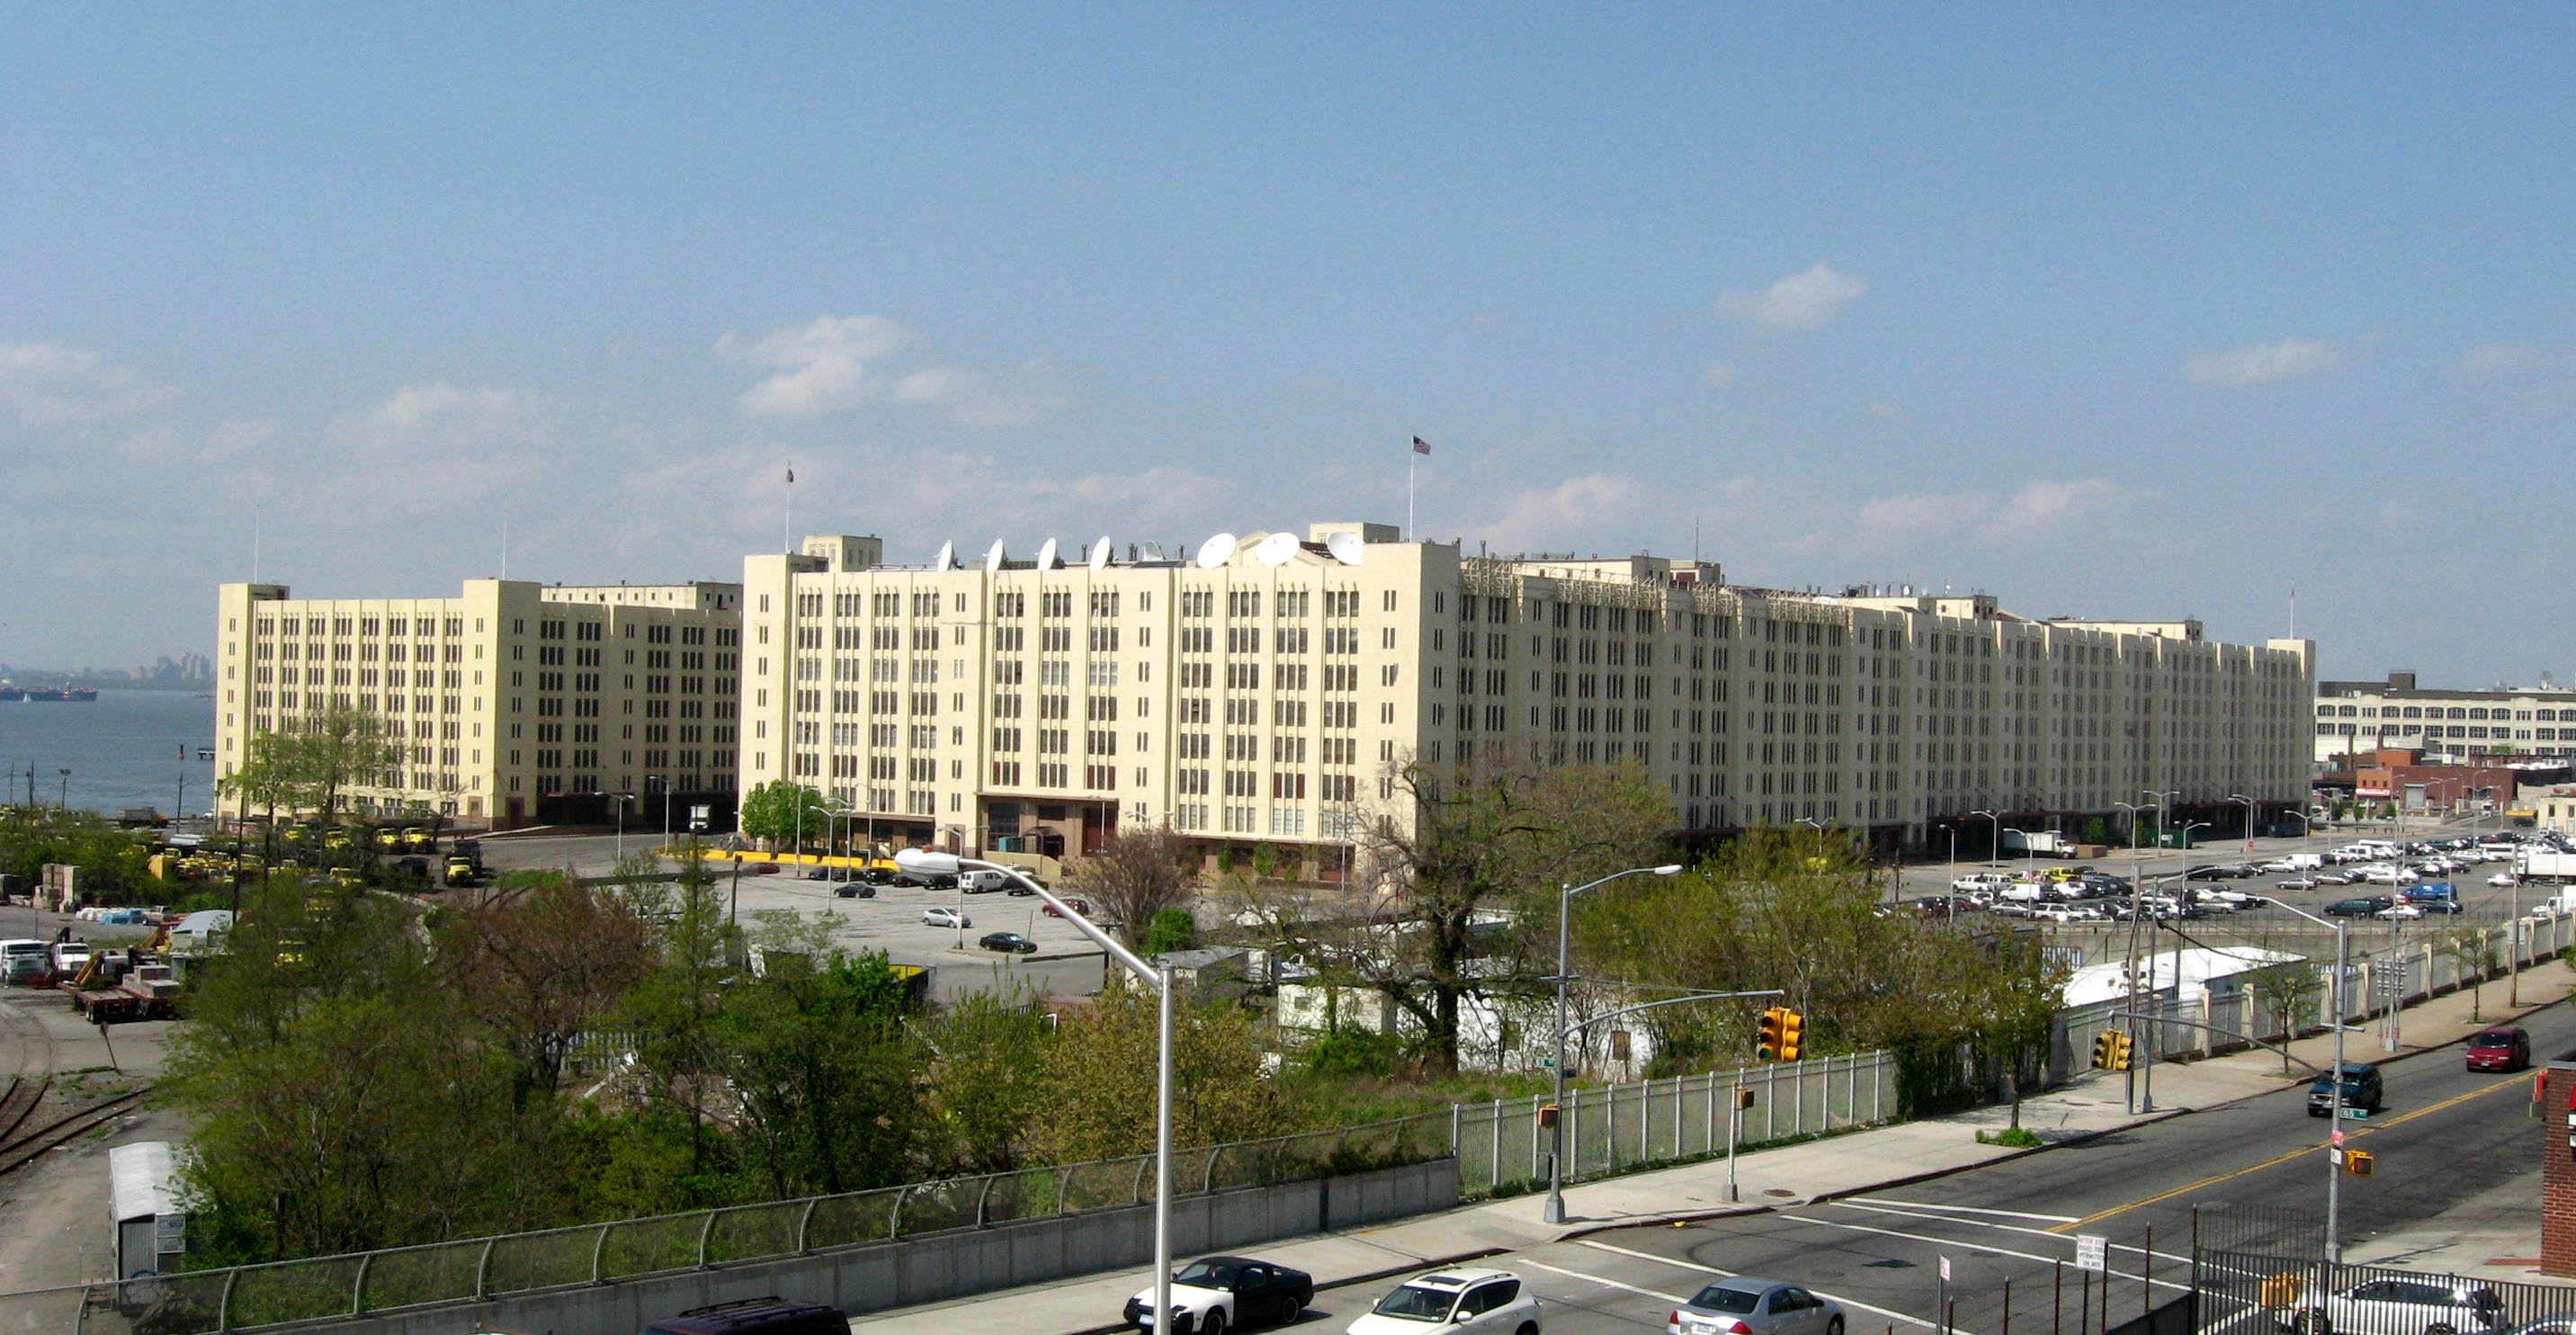
Looking northwest from Gowanus Expressway downramp in the 50s at Brooklyn Army Terminal and Bush Terminal in background on a sunny early afternoon in springtime. Public Domain phto; all may use for all purposes.
Brooklyn Army Terminal, location of the Sunset Park Solar community-led solar project.
Energy burden is highest in the Bronx, Southern/ Central Brooklyn, and Southeastern Queens. Seven of the top ten neighborhoods with the highest proportion of households that are utility burdened are EJ Neighborhoods in the Bronx and Brooklyn. The accompanying demographic chart shows that a higher proportion of Black and Hispanic or Latino residents compared with NYC overall, and a lower proportion of white residents are the most utility- burdened households.
High energy burden for heating or cooling can have multiple, compounding effects on the health of low- income households. When residents are unable to properly regulate the temperature in their homes, it can exacerbate pre-existing health conditions such as asthma and cause mental health issues such as stress and depression.378Draft Disadvantaged Communities Criteria and List Technical Documentation. (2022). NYS Climate Justice Working Group. NYS Government. The inability to afford energy costs or the need to forgo other basic necessities to pay utility bills contributes to energy insecurity: the inability to adequately meet basic household energy needs.379Understanding “energy insecurity” and why it matters to health. (2016). Hernández, D. Social Science & Medicine, 167. Academic Research.
In the hotter months, heat related illness and mortality are of particular concern. The neighborhoods with the highest vulnerability to heat, as determined by DOHMH’s heat vulnerability index (HVI), are found in historically redlined neighborhoods including the Central and South Bronx; Harlem, Manhattan; central and eastern Brooklyn; and Jamaica and Hollis, Queens.380ENDNOTECOPY Many of these high heat neighborhoods have the lowest rates of air conditioning at home. In 2017, the neighborhoods with the lowest access to air conditioning at home were all located in areas with high HVI scores, and nine out of the top ten neighborhoods are EJ Neighborhoods.381, 382, 383ENDNOTECOPY In addition, 15 percent of NYC adults with air conditioning rarely or never use it, most often because of cost concerns.384Awareness, Risk Perception, and Protective Behaviors for Extreme Heat and Climate Change in New York City. (2018). Madrigano, J., et al. International Journal of Environmental Research and Public Health, 15(7). Academic Research. Extreme heat and heat exposure is discussed further in Exposure to Climate Change (p. 140).
Top 10 Neighborhoods with the Most Households without Air Conditioning
| NEIGHBORHOOD (PUMA) | PERCENT OF HOUSEHOLDS WITHOUT AIR CONDITIONING | PERCENTAGE OF CENSUS TRACTS CLASSIFIED AS AN EJ AREA |
|---|---|---|
|
Morrisania-East Tremont, BX* |
24% |
98% |
|
University Heights-Fordham, BX* |
20% |
100% |
|
Brownsville-Ocean Hill, BK* |
18% |
100% |
|
Central Harlem, MN* |
18% |
92% |
|
Williamsbridge-Baychester, BX* |
17% |
71% |
|
Rockaways, QN* |
17% |
60% |
|
Jamaica, QN |
16% |
44% |
|
Mott Haven-Hunts Point, BX* |
16% |
100% |
|
Highbridge-South Concourse, BX* |
15% |
100% |
|
East Harlem, MN* |
15% |
94% |
*EJ Neighborhood
SOURCE: NYC Department of Health and Mental Hygiene, Environment & Health Data Portal, 2017.
Lack of access to heat in colder months also presents health risks including asthma and stress.385Draft Disadvantaged Communities Criteria and List Technical Documentation. (2022). NYS Climate Justice Working Group. NYS Government. Landlords who do not provide proper heating in colder months may cause residents to resort to heating their homes with their ovens or supplemental heaters. These practices increase the risk for fire, as evidenced by the 2022 Twin Parks apartment fire in the Bronx that killed 17 people and displaced more than 100 households.386The tragedies of Twin Parks and Grenfell are reminders that housing has become a matter of life or death for millions. (2022). USApp. News Article. Consistent and affordable access to utilities is critical to ensure a safe and healthy home.
Lead in Housing Plumbing
New York City tap water is celebrated for its high quality and continues to meet federal and State regulations. While the City-operated water mains do not contain lead, DEP estimates that there are up to 130,000 privately-owned lead service lines that connect water mains to customer buildings in the city.387Lead Free NYC: Water. (2023). NYC DEP. NYC Government. DEP distributes residential drinking water testing kits for free to New Yorkers who request them to enable residents to determine their level of exposure to lead from lead service lines, lead solder or lead containing fixtures and whether simply flushing their water can reduce or eliminate exposure.
Seven of the top ten neighborhoods with the greatest proportion of potential lead service lines (of the total number of service lines in each area) are in eastern Queens. Three of those Queens neighborhoods are EJ Neighborhoods (South Ozone Park, East Elmhurst, and Baisley Park). The three other neighborhoods with the highest number of lead service lines are EJ Neighborhoods in the Bronx (Parkchester, West Farms-Bronx River, Van Nest-Morris Park-Westchester Square). Black residents are strongly overrepresented in the top ten neighborhoods containing potential lead service lines (37 percent in the top ten neighborhoods compared to 21 percent of the population citywide).
Potential Lead Service Lines
This map shows potential lead service lines by NTA normalized by total service lines. A higher percentage means a greater likelihood of privately-owned lead service lines connecting buildings to the water main.
Demographics of Neighborhoods with the Highest Density of Potential Lead Service Lines

*By density of potential lead service lines
Source: US Census Bureau, American Community Survey, 2017-2021 5-Year Estimates. NYC Department of Environmental Protection, Lead Service Line Coordinates, 2022.
Top 10 Neighborhoods with the Highest Density of Potential Lead Service Lines
| NEIGHBORHOOD (NTA) | POTENTIAL LEAD SERVICE LINES | POTENTIAL LEAD SERVICE LINES NORMALIZED BY NUMBER OF SERVICE LINES | PERCENTAGE OF CENSUS TRACTS CLASSIFIED AS AN EJ AREA |
|---|---|---|---|
|
Parkchester, BX* |
146 |
38% |
73% |
|
Hollis, QN |
1,411 |
38% |
0% |
|
Queens Village, QN |
4,461 |
37% |
0% |
|
West Farms-Bronx River, BX* |
805 |
36% |
100% |
|
Van Nest-Morris Park-Westchester Square, BX |
1,474 |
36% |
36% |
|
Glendale, QN |
2,256 |
34% |
22% |
|
St. Albans, QN |
4,200 |
34% |
0% |
|
South Ozone Park, QN* |
4,922 |
33% |
67% |
|
East Elmhurst, QN* |
1,118 |
32% |
100% |
|
Baisley Park, QN* |
2,474 |
31% |
54% |
*EJ Neighborhood
SOURCE: NYC Department of Environmental Protection, Lead Service Line Location Coordinates, 2022.
Key data limitations include gaps in the private lead service line data, which is based on historical data and observations collected by plumbers and City workers. Contamination can also be introduced “behind the meter” in buildings, meaning the water is high quality when it arrives at the building but then runs through old plumbing in the buildings that can introduce contaminants into water which is tested only when individual households request voluntary, self-administered testing. Landlords are required to have water tanks tested annually for sanitary conditions, sediment, biological growth, floatables, pests, and coliform bacteria, however there are significant gaps in the self-reported data.
Noise
The effects of urban noise in the home can disrupt quality of life and result in and exacerbate long- term physical and mental health conditions, including sleep disturbance, increased stress, high blood pressure, cardiovascular disease, and impaired cognitive performance in children.388Epi Data Brief: Ambient Noise Disruption in New York City. (2014). NYC DOHMH. NYC Government., 389Environmental noise-induced cardiovascular, metabolic and mental health disorders: a brief review. (2022). Zaman, M., Muslim, M., and Jehangir, A. Environmental Science and Pollution Research, Defined as unwanted or disturbing sound, noise pollution is linked to transportation infrastructure and high-traffic land uses, often located in or adjacent to EJ Areas, such as highways, airports, elevated trains, and land uses such as waste transfer stations, warehousing, and industry. As such, noise levels are often higher in communities with low- income populations. Queens community groups repeatedly voice concerns to the Port Authority of New York and New Jersey over noise from the borough’s two airports, JFK, and LaGuardia. In 2012, residents observed a noticeable increase in noise pollution when the Federal Aviation Administration approved a new takeoff trajectory that concentrated low-flying planes over the northeastern section of the borough.390Engaging in a Softer Conversation About the Roar From New York’s Airports. (2015). Semple, K. The New York Times. News Article.
Program/Policy Spotlight
Lead Service Line Replacement Program
LEAD AGENCY: NYC Department of Environmental Protection (DEP)
New York City’s water supply is virtually lead- free when it is delivered from the City’s upstate reservoir system. However, water can absorb lead from solder, fixtures, and pipes found in the plumbing of some buildings. Across the city, lead has been detected in the drinking water of some homes with lead service lines, which are characteristic of homes (especially 1-4 family homes) built before 1961, or lead-soldered internal plumbing, which was in use until 1987.
About 16 percent of the water service lines in New York City are potentially composed of lead, 58 percent are confirmed to be lead-free, and the material composition of the remaining 26 percent is unknown.391Lead Service Line Location Coordinates. (2023). NYC DEP. NYC Government.
Accordingly, DEP has implemented treatment to minimize lead exposure, such as adjusting the pH levels of water entering the City’s pipes and adding phosphoric acid, which forms a protective film on household plumbing to minimize corrosion and prevent lead from leaching out of pipes. In addition, the agency received a $5.3 million grant from NYS and developed a pilot program to replace lead service lines across the city.392ENDNOTECOPYThe pilot reached out to about 3,500 homeowners, received responses from about 1,000 addresses, and ultimately just under 600 service lines were replaced.
The pilot was targeted at the lowest income homeowners, with eligibility limited to those who already qualified for financial support through the Home Energy Assistance and the Home Water Assistance Programs. By using such narrow eligibility criteria, the agency sough to make the best use of the available funding.
Still, the agency had to supplement the NYS grant with about $3 million of its own funds to complete the service line replacements. This demonstrates DEP’s commitment to the undertaking, as well as the enormous financial implications of completing citywide replacements, given that the pilot addressed less than 0.4 percent of the confirmed lead service lines in the city.
To this end, DEP has already begun applying for funding for the next phase of the program which will expand the eligibility criteria beyond beneficiaries of home assistance programs. In line with the City’s efforts to prioritize investment in EJ communities, the new criteria prioritize neighborhoods with median household income under $47,000, lead service line density over 25 percent, and over five percent of the population comprised of children under five years of age.393ENDNOTECOPYSpecifically, the agency applied for a $57 million grant from New York State made available through the Bipartisan Infrastructure Law. However, with about $104 million allocated for the entire state, the State has placed an annual $10 million cap on replacement grants and $14 million in loans for each municipality.394FFY 2023 Drinking Water State Revolving Fund Intended Use Plan, Amendment #4. (2023). NYS Department of Health. NYS
In the future, the program also plans to engage residents in multiple formats through mailers and neighborhood town halls and will limit project contracts to smaller geographies to attract more diverse contractors and increase replacement efficiency. With the right amount of funding, these changes could improve an already beneficial environmental justice program and drastically reduce the incidence of lead in New Yorkers’ drinking water.
A 2014 report from DOHMH found that for New York residents the highest rates of frequent disruptive noise exposure (FDNE), defined as three or more noise disruptions per week, were found among those who were unable to work or unemployed and those in the poorest households (income less than 400 percent of the Federal Poverty Level).395Epi Data Brief: Ambient Noise Disruption in New York City. (2014). NYC DOHMH. NYC Government. The borough with the highest prevalence of reported noise disruption was Manhattan (43 percent reporting), followed by Brooklyn (40 percent) and the Bronx (39 percent). Upper and Lower Manhattan, the South and Central Bronx, Sunset Park, and East New York were the neighborhoods with the highest rates of FDNE. Children, older adults, and those with pre- existing cardiovascular conditions are particularly at risk.396</span >
Key limitations of research on urban noise include difficulty measuring hyper-local and temporary noise interruption, and difficulty in disaggregating observed noise levels with high-contributing sources. Workplaces are a significant contributing factor to noise exposure, and those who work in industrial, manufacturing, transportation, and construction jobs are affected the most. Time spent outdoors and the sound insulation quality of buildings can impact an individual’s exposure. The City does not systematically monitor ambient noise or the prevalence of noise disturbance but the City does track noise complaints through 311 and enforces the New York City Noise Code. Noise complaints specific to restaurants and bars are tracked by the NYPD and were not available for this analysis.
As of 2022, DEP is conducting a small pilot program to improve noise monitoring and enforcement efforts. The pilot uses a roadside sound meter and camera to capture evidence of vehicles emitting noise in violation of New York State’s Vehicle and Traffic Law and the City’s Noise Code. Owners in violation of the law are subsequently sent a notice and encouraged to bring the vehicle into a DEP facility for compliance or face risk of fines.
Many Health-related Housing Maintenance Issues are Often Associated with Older and Less Energy- Efficient Buildings, While Modern, Energy- Efficient Buildings Tend to Offer Better Indoor Air Quality, Including Lower Indoor Concentrations of Particulate Matter, Carbon Dioxide, and Volatile Organic Compounds, Lower Fluctuations in Temperature and Humidity Year-round, and Lower Risk of Allergic Symptoms in Children.
Stakeholder Input
The following collection of quotes from the focus groups and interviews, conducted as part of the qualitative research for this report, speak to the myriad issues associated with housing quality and environmental justice.
Health-related Housing Maintenance Issues
“Safe, sanitary housing—that is the cornerstone of addressing EJ issues.”
“The apartment building is cut up into four, five, or six small rooms…They created these mini apartments within the apartments because rent’s so high…So a lot of immigrants would end up renting these spaces…It’s in an appalling state and you have three or four families there.”
“There were a lot of kids that came into our organization who had high levels of lead and they didn’t know where we’re coming from. And what we found out through the Department of Buildings was that the landlords—the slum lords—were painting over the lead paint…and the kids were taking pieces of the paint that was peeling off and eating it. And we called the Department of Buildings. At times we even held a protest. And the only reason they came out was that we got the media involved.”
Utility Access and Affordability
“In the summer, if you want an A/C, you have to pay extra money on top of your rent…It’s getting really hard and difficult. The same thing with the heat… We sometimes don’t have hot water and heat and it gets frustrating…We have to make sure there are no gaps in the window, because …it’s just becoming difficult to live here.”
“New clean energy programs are inaccessible. They are not translated into the languages my communities speak. It is difficult to access program information, and it is unclear how to get financing.”
Public Housing
“I know the whole complex is having issue with [heat]. We have to turn the oven on, open the oven so that it can produce some type of heat because it’s so cold. We have to boil water and take showers like that, because sometimes we don’t have hot water in the winter and it’s really, really cold.”
“Lack of funding to keep NYCHA apartments in a state of good repair is an environmental injustice… NYCHA residents face exposure to indoor air contaminants, including mold, lead, asbestos; and vendors hired to remediate these conditions often do not provide the same quality of work for NYCHA households.”
Noise
“[There’s a lot of] airport related noise and air quality [issues]…Planes fly low to accommodate two airports in similar air space.”
Next:Exposure to Polluted Water >>