This section focuses on access to resources across six issues and indicators: redlining, capital planning, land use planning and zoning, transit and alternative transportation access, open space and natural resources, and food and nutrition. The findings point to opportunities for the City to invest in EJ communities and coordinate with permitting and regulatory authorities to embed equity and environmental justice in the siting and permitting of infrastructure.
Providing fair access to resources for all New Yorkers, regardless of socioeconomic identity, is a critical step towards environmental justice. Neighborhoods with ample parks and open space provide refuge from heat and spaces for community building. Safe, reliable transit options improve mobility and expand educational and economic opportunities beyond neighborhood boundaries. Affordable fresh food options provide the nutrition necessary to live an active life. These resources are social determinants of health: the conditions in the environments where people live, work, learn, and play that affect health, functioning, and quality of life outcomes and risks138Healthy People 2030. (n.d.). US Department of Health and Human Services. US Government..
These resources are not distributed equitably across New York City neighborhoods. Within neighborhoods, additional demographic factors can further impact access to resources such as age, race and ethnicity, income, gender, sexual orientation, disability, language, and immigration status. Those who are most negatively impacted by a lack of resources are low-income communities and communities of color. Systemic racism entrenched in policies, institutions, programs, and processes creates disadvantages for people of color and advantages for white people.
key Findings
The impact of redlining persists today: historically redlined areas have a higher proportion of Black and Hispanic or Latino residents compared to the city overall.
![]()
![]()
![]()
Average Amount of Accessible Park Space Per 1,000 Residents:
EJ AREAS:
9
acres
NON-EJ AREAS:
11
acres
19%
less park space for residents in EJ Areas
Data Analysis
Redlining
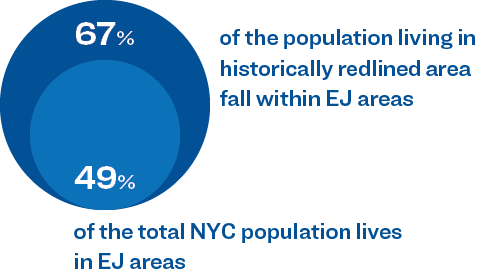
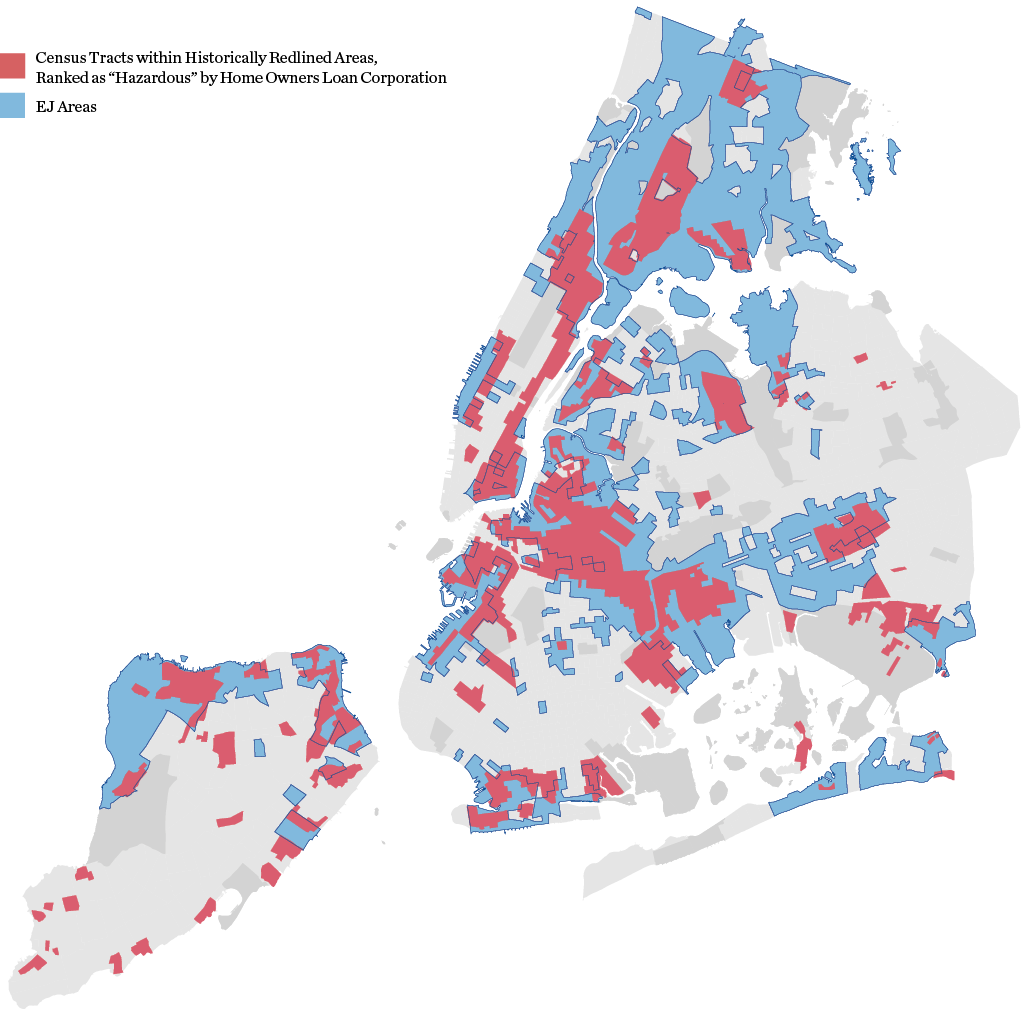
Between 1935 and 1940, the Home Owners’ Loan Corporation (HOLC) created residential security maps, assigning rankings to neighborhoods across the country from “A (Best)” in green to “D (Hazardous)” in red, which is how the term “redlining” came about.139Mapping Inequality. (2023). Nelson, K., Winling, L., Marciano, R., Connolly, N., et al. American Panorama. ed. Nelson, R. and Ayers, E. Digital Scholarship Lab, University of Richmond. Academic Institution. 67 percent of the total population in historically redlined areas fall within EJ Areas, in comparison to the 48 percent of the total NYC population that lives in EJ Areas. Additionally, historically redlined areas have a higher proportion of Black and Hispanic or Latino residents compared to the city overall.
Historical redlining can be an indicator of present-day environmental and health outcomes. Historically redlined neighborhoods are more likely to lack green space in comparison to other neighborhoods.140Redlines and Greenspace: The Relationship between Historical Redlining and 2010 Greenspace across the United States. (2021). In addition to its physical and mental health benefits, urban green space mitigates the impacts of climate hazards such as flooding and extreme heat.141Value of urban green spaces in promoting healthy living and wellbeing: prospects for planning. (2015) Lee, A., Jordan, H., and Horsley, J. Risk Management and Healthcare Policy, 8. Academic Research Historically redlined neighborhoods often experience higher heat vulnerability compared to non-redlined areas.142The Effects of Historical Housing Policies on Resident Exposure to Intra-Urban Heat: A Study of 108 US Urban Areas. (2020). Additionally, babies born in historically redlined neighborhoods in New York City between 2013 and 2017 were 46 percent more likely to be born pre-term than babies in neighborhoods previously rated “A.”143Structural Racism, Historical Redlining, and Risk of Preterm Birth in New York City, 2013-2017. (2020). Krieger, N., Van Wye, G., Huynh, M., et al. American Journal of Public Health, 110(7). Academic Research. Increased risk of preterm birth is linked to environmental hazards such as prolonged exposure to extreme heat and poor air quality.144Association of Air Pollution and Heat Exposure with Preterm Birth, Low Birth Weight, and Stillbirth in the US. (2020). Bekkar, B., Pacheco, S., and Basu, R. JAMA Network Open, 3(6). Academic Research.
Racial disparities are prominent in homeownership. White and Hispanic or Latino New Yorkers represent similar population sizes, comprising 31 percent and 28 percent of the city, but have stark disparities in homeownership, representing 49 percent and 14 percent of homeowners, respectively.147American Community Survey 5-year estimates. (2017-2021). US Census Bureau. US Government. Black homeowners are also slightly underrepresented: they comprise 19 percent of the homeowners despite making up 20 percent of the city’s population. Home equity makes up nearly two-thirds of wealth for the median American family.148The racial wealth gap: How African-Americans have been shortchanged out of the materials to build wealth. (2017). Janelle Jones. Academic Research. At the national level, Asian households have the highest median net worth ($264,800), followed by white households ($217,500), Hispanic or Latino households ($39,800), and Black households ($18,430).149ENDNOTECOPY Lower rates of home ownership and devalued land in communities of color has led to lower generational wealth, which in turn negatively affects access to resources such as adequate healthcare, education, and transportation.
Historically Redlined Areas
Demographics of Historically Redlined Areas

SOURCE: Robert K. Nelson, LaDale Winling, Richard Marciano, Nathan Connolly, et al., “Mapping Inequality,” American Panorama, ed. Robert K. Nelson and Edward L. Ayers. US Census Bureau, American Community Survey, 2017-2021 5-Year Estimates. NYS Department of Environmental Conservation, Disadvantaged Communities Criteria, 2023.
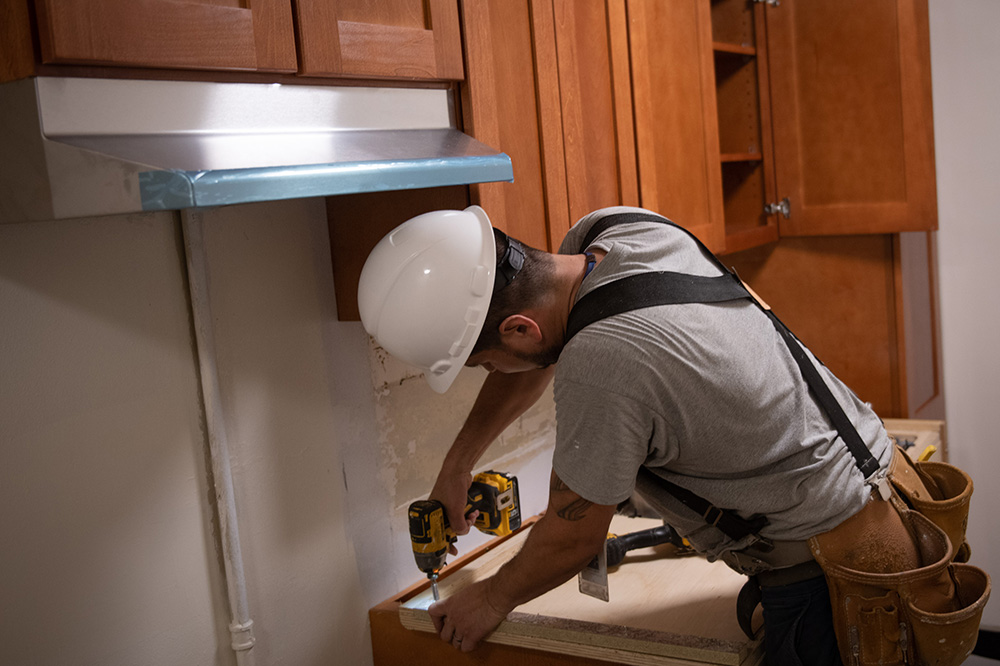
Repairs at NYCHA’s Betances Houses in the Bronx.
Program/Policy Spotlight
Get Stuff Built: a Report of the Building and Land Use Approval Streamlining Taskforce (blast)
LEAD AGENCY: Multi-agency Coordination
Released in December 2022, the “Get Stuff Built” report outlines the BLAST’s recommendations for streamlining City processes related to environmental review, special permits and land use approval, and building permitting, with the aim of “providing affordable housing, supporting small businesses and delivering capital projects.” The report, developed by a multi-agency taskforce of over two dozen City agencies, makes 111 recommendations, with 45 related to CEQR, 19 to ULURP, and 47 to the Department of Building’s (DOB) permitting process.145Get Stuff Built: BLAST Report. (2022). NYC Mayor’s Office. NYC Government.
The “Get Stuff Built” report recommends changes to CEQR that are aimed at streamlining environmental impact analyses, increasing collaboration among City agencies and building their capacity to participate in the review process. In addition to process improvements, the report presents potential updates to the CEQR Technical Manual. For instance, the plan proposes to update the methodology for assessing socioeconomic impacts, which include potential displacement. Any such changes could address criticism that the current methodology underestimates displacement impacts.146ENDNOTECOPY
The report recommends the creation of a CEQR Handbook to provide the public and Community Boards with guidance on CEQR methodologies and ways to participate in the public comment process. The handbook is intended to support community-based organizations and EJ communities in navigating the review process and advocating for their needs. Additionally, the report recommends process changes that make applications available for public review earlier in the ULURP process, and changes to diversify public communication and outreach formats, such as creating a notification system that alerts resident subscribers to zoning applications in their neighborhoods. The report also proposes the exemption of certain actions from the environmental quality review and land use approval process. Such actions include the development of some homeless shelters and housing projects, battery storage facilities and other energy projects, and land acquisitions of flood-prone properties for the creation of Bluebelts, cloudburst interventions, and new parks. The new approach to acquisitions are intended to facilitate ongoing efforts to meet the City’s affordable housing, carbon neutrality, and climate resilience goals.
By modifying the framework for completing rezoning projects, this ambitious plan should facilitate faster housing construction and necessary infrastructure development and helps the City in its aim to prioritize equity in the siting of infrastructure.
Capital Planning
New York City funds larger, long-term investments in facilities and infrastructure through its Capital Budget. Specifically, capital projects are defined as the construction, reconstruction, acquisition, or installation of a physical public improvement with a value of $50,000 or more and a “useful life” of at least five years.150Understanding New York City’s Budget: A Guide. (2021). NYC IBO. NYC Government. This includes bridge reconstruction, water and sewer system upgrades, and parks improvements.
While the City Council adopts a Capital Budget each year, the planning and actual expenditure of funds for capital projects generally occurs over a period of years in accordance with City Charter provisions. Every November in even-numbered years, the Mayor’s Office of Management and Budget (OMB) and the Department of City Planning jointly prepare a draft Ten-Year Capital Strategy that outlines the goals, policy constraints, assumptions, and criteria for assessing the City’s capital needs over the next 10 years. The document also includes reflections on the economic, social, and environmental implications of the proposed strategy. This provides a comprehensive framework for prioritizing, funding, and efficiently managing capital projects to meet the city’s evolving infrastructure and service needs.
The preparation of the Capital Budget is a lengthy process designed to consider neighborhood, borough, and citywide needs. The Borough Presidents collectively receive 5 percent of the discretionary portion of the capital budget, which is allocated based on each borough’s population and total geographic area. In the Fall, each of the city’s Community Boards hosts public hearings for residents, community organizations, and other stakeholders to voice their opinions and concerns regarding potential capital projects. This input is integrated into a statement of capital priorities that is submitted to the Mayor and relevant Borough President for consideration. Similarly, City agencies submit their own estimates of their capital needs. Once the Mayor presents the Preliminary Capital Budget in January, the Community Boards and Borough Presidents once again hold public hearings to assess whether the proposed budget addresses their capital priorities. Each Borough President issues recommendations to revise the budget before the final version is approved by Mayor and City Council.
Land Use Planning and Zoning
Zoning organizes how land may be used, establishing an “orderly pattern of development across neighborhoods and the city by identifying what may be built on a piece of property. It defines what land uses are allowed to occur on a piece of property (considering compatibility with nearby uses) as well as the shape of buildings that may be constructed. Zoning regulations set limits on how a property owner may use land rather than requiring them to use it in a particular way. How zoning is administered can have an impact on environmental justice outcomes. For example, overly restrictive zoning can limit the development of affordable housing, which can increase inequality.
City of Yes for Carbon Neutrality
The Department of City Planning’s City of Yes for Carbon Neutrality was adopted by City Council in December 2023. This citywide zoning text amendment will facilitate climate action, clean energy, and resiliency by removing barriers to greener and more efficient energy systems, buildings, transportation, and water and waste systems. The updates to zoning will help reduce New York City’s operational carbon emissions 80 percent by 2050, in accordance with the Paris Climate Accords. The initiative updates outdated regulations that created major roadblocks for New Yorkers who hoped to retrofit their homes for energy efficiency or resiliency, install heat pumps or solar panels, switch to electric vehicles, or compost and recycle—all critical steps for New York City to reach its ambitious environmental goals.
Among other changes, this initiative removes zoning obstacles that limit how much rooftop space can be covered by solar panels and would facilitate standalone, grid-supporting solar and community microgrids—particularly in low-income communities—that are currently banned in residential areas, more than doubles commercially-zoned land where electric- vehicle charging facilities can be located, and expands the use of permeable pavement and rain gardens. This initiative is the first of three “City of Yes” proposals to update New York’s zoning for the 21st century and foster a more sustainable, prosperous, and equitable city.
The New York City Zoning Resolution is intended to address multiple planning objectives such as affordable housing, walkability, and climate resiliency. Changes to zoning require a legislative action that is either citywide or specific to one area. It may be needed to allow a development at a location or in a configuration that is not currently permitted. Anyone, including an individual or the City, may propose a change to zoning. Changes to zoning may be adopted only after a formal public review process, where they must ultimately be approved by the City Planning Commission and adopted by the City Council, as set forth in the City Charter. This public review process is called the Uniform Land Use Review Procedure (ULURP) which sets time frames for formal public participation in the review of land use actions. The role of the City Planning Commission and the City Council is to hear and understand the views of the public as one consideration of many when looking to meet the City’s broader needs for more housing, infrastructure capacity, and climate considerations.
Changes to zoning must also be assessed for environmental impacts in accordance with the State Environmental Quality Act (SEQRA) and City Environmental Quality Review (CEQR). CEQR is a disclosure process by which City agencies determine what effect, if any, a discretionary action (such as rezoning, issuing special permits, or approving public funding for construction projects) may have on the environment, and mitigate to the greatest extent practicable the significant environmental impacts of such project’s environment, and mitigate to the greatest extent practicable. The New York State Cumulative Impacts Law is set to expand environmental justice considerations under CEQR. Under the new law, agencies must consider a proposed action’s potential to “cause or increase disproportionate or inequitable or both disproportionate and inequitable burden on a disadvantaged community.”
See “Program/Policy Spotlight: Get Stuff Built: A Report of the Building and Land Use Approval Streamlining Taskforce” for more information about the City’s efforts to increase transparency and access to information related to proposed changes to zoning and speed up the creation of affordable housing, drive economic growth, and build stronger communities.
Transit and Alternative Transportation Access
Reliable, accessible transportation is critical to access jobs, educational opportunities, and essential services like healthcare. In this analysis, transportation includes public mass transit, like the subway and bus systems, and alternative transportation to support shorter trips, like bikes and e-scooters. On average, residents in EJ Areas have greater proximity to subway stations and bus stops overall than residents in non-EJ Areas: 78 percent of residents in EJ Areas are within a half- mile of a Metropolitan Transportation Authority (MTA) subway station, compared to 64 percent of residents in non-EJ Areas; and 98 percent of residents in EJ Areas are within a quarter-mile of a bus stop, compared to 96 percent of residents in non-EJ Areas. Residents in EJ Areas have slightly less proximity to Select Bus Service (SBS) stops than residents in non-EJ Areas. SBS is New York City’s version of Bus Rapid Transit: an improved bus service that offers fast, frequent, and reliable service on high-ridership bus routes. 19 percent of residents in EJ Areas live within a quarter-mile of an SBS bus stop, compared to 22 percent of residents in non-EJ Areas. Transit reliability and accessibility can vary between neighborhoods due to myriad factors and quantifying potential disparities is challenging. However, measuring transit access to opportunity is one way of evaluating transit equity.151ENDNOTECOPY
TransitCenter’s Transit Equity Dashboard, which assesses the number of jobs a resident in New York City can reach within a 45-minute transit commute, shows that resident commute times vary widely by racial and ethnic groups. The average white resident can access 991,688 jobs within a 45-minute transit commute.152ENDNOTECOPY Within a 45-minute transit commute, Asian, Hispanic or Latino, and Black residents have access to 14 percent, 22 percent, and 44 percent fewer jobs, respectively, than their white counterparts. There is likely no single cause behind the observed racial differences in job access but a combination of potential contributing factors such as high housing costs in job-dense areas and legacies of residential segregation.153The Problem Has Existed over Endless Years: Racialized Difference in Commuting, 1980-2019. Bunten, D., Fu, E., Rolheiser, L., and Severen, C. Federal Reserve Bank of Philadelphia. Academic Research.
The Community Service Society of New York’s survey of low-income communities found that a quarter of New Yorkers living in poverty said they struggled to afford subway or bus fares.154Mass Transit as an Economic Equalizer: The Case for Expanding and Investing in Fair Fares. (2022). Chatterjee, D., Lew, I., and Torres, Hispanic or Latino and Black residents report the highest rates of transit hardship across racial groups; Bronx residents report the highest rates of transit hardship across the five boroughs. The MTA’s Fair Fares program offers discounted fares to the New Yorkers whose income falls below the poverty line, but many qualifying residents are not aware of the program.155Mass Transit as an Economic Equalizer: The Case for Expanding and Investing in Fair Fares. (2022). Chatterjee, D., Lew, I., and Torres, Transit fares can still be a financial burden for those living above the poverty line: a 30-day unlimited MetroCard amounts to 3 percent of median monthly income for public transit commuters.156ENDNOTECOPY
Historically, over-policing and anti-fare evasion policies have disproportionately affected Black and Hispanic or Latino riders. From 2010 to 2018, Black transit riders were 10 times more likely than white transit riders to be arrested for fare evasion.157NYC Fare Evasion. (2018). Rothbacher, N. Academic Research. Hispanic or Latino transit riders were 5 times more likely to be arrested. The Bronx had a significantly greater proportion of fare evasion arrests than its share of transit ridership.
Achieving equitable transit access includes implementing proper accommodations and transit options for people with mobility impairments. Currently, about 30 percent of subway and Staten Island Railway stations are ADA accessible.158Elevate Transit: Zoning for Accessibility. (n.d.) NYC DCP. NYC Government. Within City limits, 68 percent of Metro-North stations and 86 percent of Long Island Rail Road stations are accessible. MTA buses are fully accessible to those in wheelchairs, and Access-A-Ride offers 24/7 paratransit service to those unable to use fixed bus stops to get to their destination. However, bus and paratransit services lack the flexibility, speed, and reliability of rapid transit service.
Program/Policy Spotlight
Vision Zero
LEAD AGENCY: Multi-agency Coordination
Each year, there are more than 200 fatalities due to traffic crashes in New York City. Traffic safety is a quality of life and environmental justice concern with health, social, and economic consequences.159 In view of this, New York City adopted the Vision Zero framework in 2013 to implement multiple data-driven strategies to reduce serious traffic crashes that result in fatalities and severe injuries.160
The Vision Zero Task Force was created to develop and implement engineering, enforcement, policy, and outreach strategies. The Task Force is an interagency group of staff from many government agencies including the Department of Transportation (DOT), Department of Citywide Administrative Services (DCAS), Department of Health and Mental Hygiene (DOHMH), the Police Department (NYPD), the Metropolitan Transportation Authority (MTA), and others.161 Key strategies include street engineering improvements, rapid bike lane deployment, use of automated speed cameras, traffic violations enforcement, and safety education.
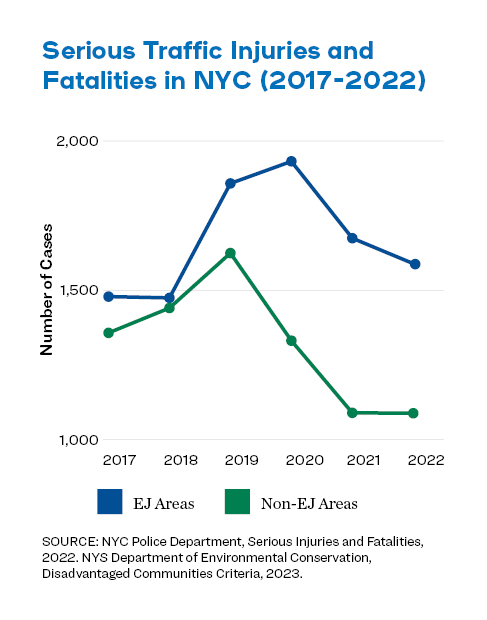
The city has experienced traffic safety improvements in the years since the program started. Between 2017 and 2022 (the most recent period for which data that can be analyzed continuously are available), there was a 6 percent reduction in the number of people killed or severely injured (KSI) in traffic crashes citywide. However, there was a notable disparity in traffic safety between EJ Areas and non-EJ Areas.
In 2022, 59 percent of crash-related fatalities and severe injuries citywide occurred in EJ Areas, despite EJ Areas making up only 44 percent of New York City census tracts and 49 percent of the population. An analysis of crashes in the same year showed that the rate of KSI per mile of roadway in EJ Areas was 1.2 times the citywide average rate and 1.4 times the rate in non-EJ Areas. Furthermore, 16 of the 19 neighborhoods with the highest KSI per mile rate (the top 10 percent) were EJ Neighborhoods. The five neighborhoods with the highest KSI per mile rate in 2022 were Fordham South, Mott Haven- Port Morris and East Tremont in the Bronx and Central Harlem South and Clinton in Manhattan.
A key instrument in the Vision Zero toolkit, the Street Improvement Project (SIP) program, makes physical changes to encourage safer travel behavior by reducing driving speeds, increasing roadway visibility, and/or separating transportation modes. SIP projects, or SIPs, are classified by their implementation zone: either along the roadway or at an intersection. The data-driven program is designed to prioritize SIPs in locations that have the greatest need for engineering improvements.162 This is reflected by an analysis of SIP density, calculated as the number of improvement projects per mile of roadway, which showed that EJ Areas have received 4 percent more SIPs per mile of roadway than the citywide average and 7 percent more than in non-EJ Areas.163
Serious Traffic Injuries and Fatalities in NYC (2017-2022)

SOURCE: NYC Police Department, Serious Injuries and Fatalities, 2022.
Vision Zero’s data-driven approach to reducing serious crashes has resulted in improvements to traffic safety citywide. However, despite these citywide improvements and those specifically in EJ Areas, EJ Areas remain disproportionately burdened by crash-related fatalities and severe injuries. In 2021, DOT established its first equity- focused Priority Investment Areas (PIAs) to drive interventions that advance safety, accessibility, and alternative modes of transportation.164 These priority areas were selected based on
the percentage of non-white and low-income populations, population and job density, and level of historic investment in each area. As such, the PIAs have the potential to drive future investment towards EJ communities and reduce the traffic safety disparities observed between EJ and non-EJ Areas. The program serves as a model of equity-driven investment to inspire change across other areas of the City’s environmental decision-making.
Top 10 Neighborhoods with the Least Bike Network Coverage
| NEIGHBORHOOD (NTA) | BIKE NETWORK COVERAGEii | PERCENTAGE OF CENSUS TRACTS CLASSIFIED AS AN EJ AREA |
|---|---|---|
|
Great Kills, SI |
0.00% |
0% |
|
Richmond Hill, QN* |
0.03% |
71% |
|
Pelham Bay-County Club-City Island, BX* |
0.19% |
57% |
|
Arden Heights, SI |
0.22% |
0% |
|
Soundview-Bruckner* |
0.28% |
100% |
|
Douglas Manor-Douglaston-Little Neck, QN |
0.32% |
0% |
|
Baisley Park, QN* |
0.47% |
54% |
|
Springfield Gardens North, QN |
0.60% |
0% |
|
Springfield Gardens South-Brookville, QN |
0.61% |
15% |
|
South Ozone Park, QN* |
0.66% |
67% |
* EJ Neighborhood
SOURCE: NYC Department of City Planning, LION Single Line Street Base Map, Release 22C, 2022.
ii Note: Greenway routes within parks and on designated park paths are included in this analysis
Citywide, the bicycle network covers a median of 15 percent of roadways across neighborhoods (meaning 15 percent of roadway miles and greenway routes include bike lanes). Within all EJ Areas, the protected bicycle network covers 4 percent of roadways (meaning 4 percent of roadway miles include protected bike lanes). This is compared to 5 percent in non-EJ areas. However, there are neighborhoods with no bike coverage at all. Of the top ten neighborhoods in New York City with the least bike network coverage are EJ Neighborhoods, and six are in Queens.
Additionally, while New York City’s bike-share program Citi Bike has expanded access to bicycle transportation, over four million New Yorkers will still live outside of the Citi Bike service area after the Phase 3 expansion.165NYC Streets Plan. (2021). NYC Department of Transportation. NYC Government. All of these neighborhoods are in the outer boroughs, including the East Bronx, most of Queens east of Flushing Meadows Corona Park, Southeast Brooklyn, and all of Staten Island. To fill this gap, DOT operates a shared e-scooter pilot in the Bronx and plans to expand the service area to eastern Queens in 2024.166NYC DOT Announces Queens Expansion of E-Scooter Sharing Program. (n.d.). NYC DOT. NYC Government.
Open Space and Natural Resources
In 2007, New York City set a long-term goal for all New Yorkers to be within walking distance of a park, with an interim goal of reaching 85 percent of New Yorkers by 2030. As of July 2023, almost 85 percent of New Yorkers are within walking distance of a park; 35,000 people are needed to be served by new public open space to reach the goal. More than 1.3 million New York City residents are not within a walking distance of a park.167Walk to a Park Initiative. (n.d.). NYC Parks. NYC Government.
Parks and open space can become overcrowded if there is insufficient park land for the size of the community. In non-EJ Areas, the average amount of accessible park space is 11 acres per 1,000 residents.iiiDefined as parks within an eighth of a mile of a census tract.
In EJ Areas, that figure is 9 acres per 1,000 residents. The following map highlights neighborhoods that fall in the bottom quartile of park acres per 1,000 residents. These areas include Midtown Manhattan, Central Brooklyn, Southern Brooklyn, Northwest Queens, and Southeast Queens. The associated table shows the top ten neighborhoods in New York City with the least park acreage per 1,000 residents. Four of these neighborhoods are EJ Neighborhoods.
Accessible Park Acres Per 1,000 Residents
Least Access to Parks is defined as the bottom 25 percent of neighborhood tabulation areas in terms of the total number of park acres accessible per 1,000 residents. Acres per 1,000 residents were calculated at the census tract level by summing all the acreage for all parks within 1/8 of a mile of the boundary of each census tract. This value was then aggregated to the NTA level (using a population weighted average). This approach takes into account parks that are accessible to a neighborhood even if they are technically outside of its borders (e.g., Central Park for the Upper East Side).
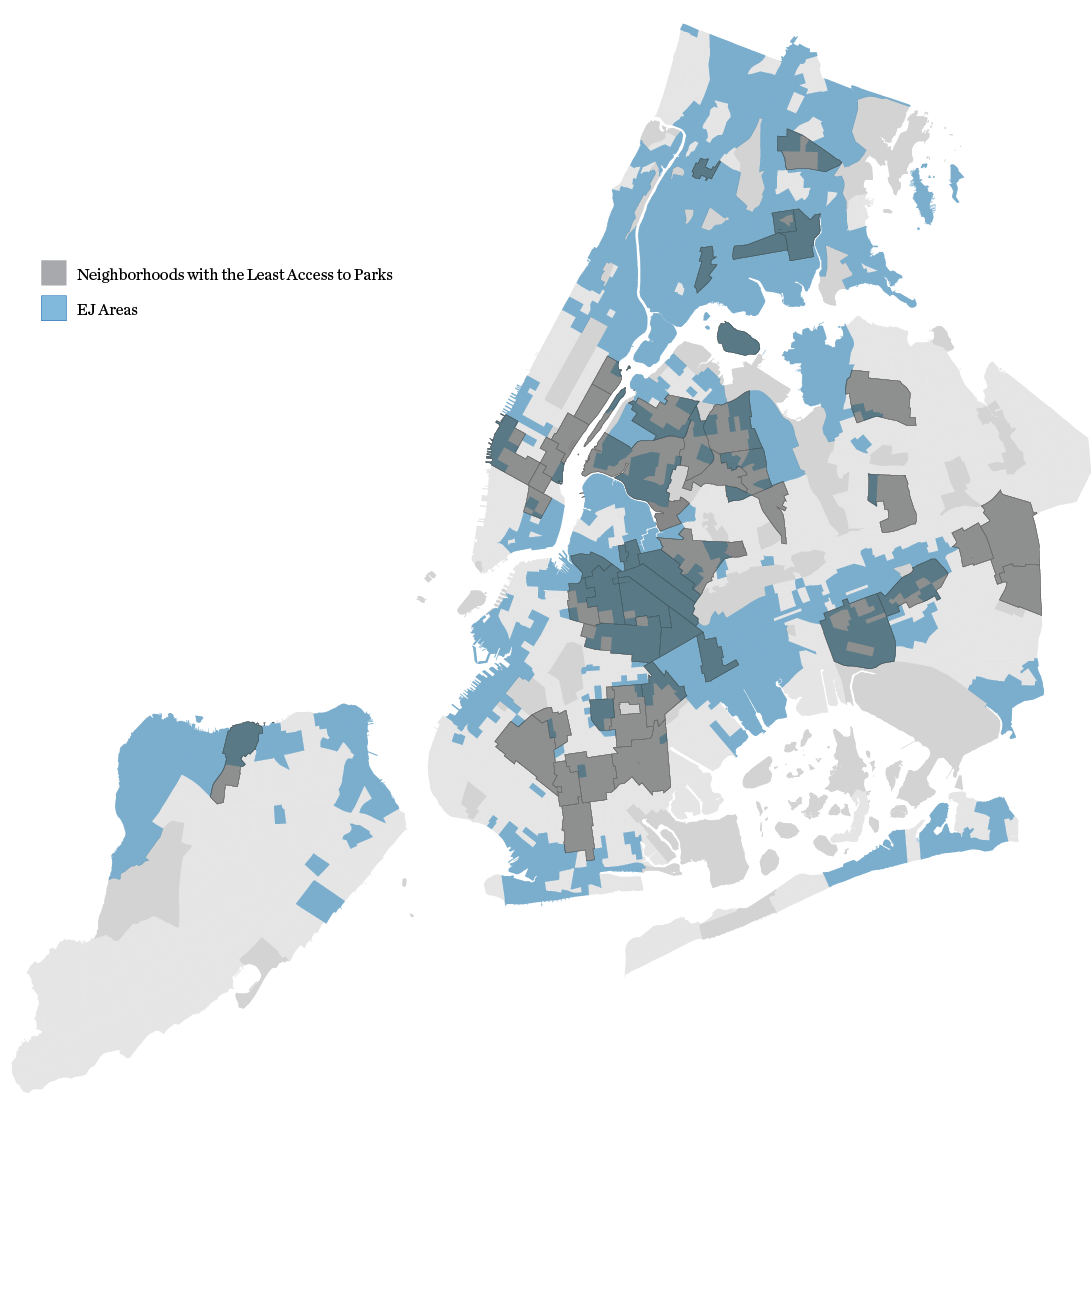
SOURCE: NYC Department of Parks and Recreation, Parks Properties, 2023. US Census Bureau, American Community Survey, 2017-2021 5-Year Estimates. NYS Department of Environmental Conservation, Disadvantaged Communities Criteria, 2023. NYC Department of City Planning, 2010 Neighborhood Tabulation Areas, 2010.
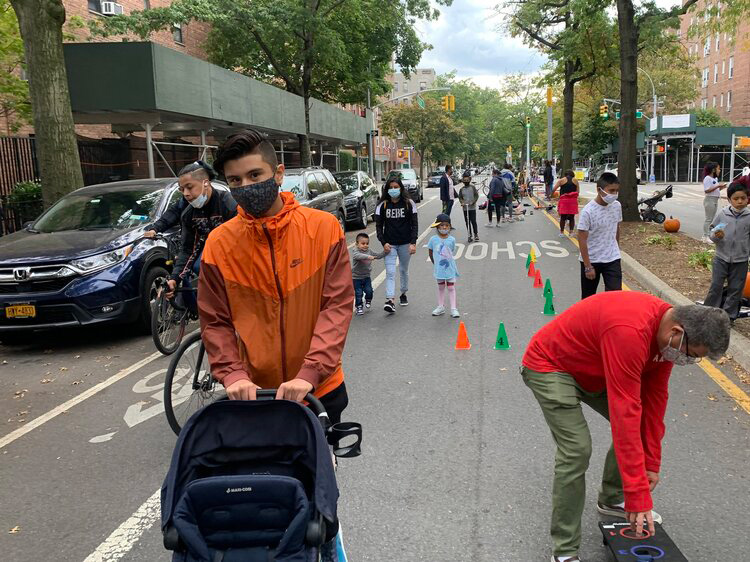
34th Ave Open Streets
Community Case Study
34th Ave Open Streets Coalition
LOCATION: Jackson Heights, Queens
In May 2020 during the height of the COVID- 19 pandemic, 34th Avenue in Jackson Heights quickly became one of the most lively and well-utilized Open Streets in the city. Closed to vehicle traffic, it served as an oasis of public space at a time when New Yorkers desperately needed safe, outdoor spaces to gather and recreate. Concerned that they would lose this space after shelter-in-place orders ended, Jackson Heights residents formed the 34th Ave Open Streets Coalition to advocate for the street to remain open permanently for pedestrians and cyclists only. Thanks to their advocacy, 34th Avenue remains an Open Street today and has grown into a robust community space where kids play, neighbors gather, and events are held. The 34th Ave. Open Streets Coalition continues to make the street a success, promoting and hosting events such as salsa classes, English as a Second Language classes, and food distribution days.168 DOT has added permanent infrastructure to 34th Ave including landscaped planters, granite blocks, and upgraded bike facilities.
A majority Hispanic or Latino neighborhood with a substantial South Asian community, Jackson Heights has among the lowest proportions of open space of any neighborhood in the city, making 34th Avenue a sorely needed community resource.169 Open Streets such as 34th Avenue provide recreation opportunities, increase community cohesion and organizing capacity, and serve as a respite from the hazards of vehicle traffic. Based on their success in Jackson Heights, the coalition has pushed to extend the Open Streets program into more neighborhoods such as Corona. In the words of Transportation Alternatives Queens organizer Juan Restrepo, “Jackson Heights is a much more politically active community [than Corona], but that shouldn’t be a deterrent for why someone shouldn’t have access to space like this.”170
Top 10 Neighborhoods with the Least Accessible Park Acres per 1,000 Residents
| NEIGHBORHOOD (NTA) | PARK ACRES PER 1,000 RESIDENTSiv | PERCENTAGE OF CENSUS TRACTS CLASSIFIED AS AN EJ AREA |
|---|---|---|
|
Rikers Island, BX* |
0 |
100% |
|
Erasmus, BK* |
0.12 |
72% |
|
Kensington-Ocean Parkway, BK |
0.13 |
10% |
|
Midwood, BK |
0.17 |
9% |
|
Elmhurst, QN* |
0.43 |
59% |
|
Elmhurst-Maspeth, QN |
0.44 |
0% |
|
Queens Village, QN |
0.46 |
0% |
|
Parkchester, BX* |
0.54 |
73% |
|
Jackson Heights, QN |
0.55 |
37% |
|
Borough Park, BK |
0.55 |
0% |
*EJ Neighborhood
SOURCE: NYC Department of Parks and Recreation, Parks Properties, 2023. iv Defined as parks within an eighth of a mile of a census tract.
iv Defined as parks within an eighth of a mile of a census tract.
It is important to note that the analysis of park acreage completed for this report considers parks that are immediately adjacent to a neighborhood (e.g., Central Park is adjacent to the Upper East Side). Other analyses aggregate green space within the boundaries of a community district or neighborhood. Therefore, existing City benchmarks for open space access (2.5 acres per 1,000 residents) may not be an appropriate point of comparison for this work.171CEQR Technical Manual. (2021). NYC Mayor’s Office of Environmental Coordination. NYC Government.
Funding is often used as a proxy metric for maintenance and quality. Parks such as the High Line, Central Park, Van Cortlandt Park, and Prospect Park operate with public-private partnerships in which conservancy groups build relationships with donors to raise funds for park management, maintenance, and operations.
Parks in other communities may be unable to leverage these additional resources and financial investments that supplement public funding. From 1992 to 2013, 215 parks across the city received less than $250,000 in capital investment from NYC Parks.172NYC Parks: Framework for an Equitable Future. (2014). NYC Parks. NYC Government. NYC Parks estimates these 215 parks need $1 billion in cumulative future capital investment.173Community Parks Initiative: Build a Bright, Green Future. (2016). Jennifer Gardner. NYC Government. Underfunded areas tend to be geographically clustered.174NYC Parks: Framework for an Equitable Future. (2014). NYC Parks. NYC Government.
The distribution of urban tree canopy coverage is lower in areas with lower household incomes and higher percentages of people of color.175NYC Urban Forest Agenda. (2021). Forest for All NYC. Community Organization. However, its distribution is improving across all boroughs. According to Forest for All NYC’s analysis of the urban forest, New York City gained 1.7 percent tree canopy coverage between 2010 and 2017, with the largest absolute gain in the Bronx (2.2 percent) and the smallest in Queens (0.9 percent).176The State of the Urban Forest in NYC. (2021). The Nature Conservancy. Nonprofit Organization.
The following table shows the ten neighborhoods in New York City with the least tree canopy coverage. Of these, six are EJ Neighborhoods.
Top 10 Neighborhoods with the Least Tree Canopy Coverage
| NEIGHBORHOOD (NTA) | PERCENTAGE OF TREE CANOPY COVERAGE | PERCENTAGE OF CENSUS TRACTS CLASSIFIED AS AN EJ AREA |
|---|---|---|
|
Midtown-Midtown South, MN |
1% |
6% |
|
Rikers Island, BX* |
2% |
100% |
|
Sunset Park West, BK* |
2% |
100% |
|
Breezy Point-Belle Harbor-Rockaway Park-Broad Channel, BK |
2% |
29% |
|
Hammels-Arverne-Edgemere, QN* |
2% |
84% |
|
Hunts Point, BX* |
3% |
100% |
|
Battery Park City-Lower Manhattan, MN |
3% |
0% |
|
Hunters Point-Sunnyside-West Maspeth, QN |
4% |
47% |
|
West Concourse, BX* |
4% |
100% |
|
East Williamsburg, BK* |
4% |
67% |
*EJ Neighborhood
SOURCE: University of Vermont Spatial Analysis Laboratory, NYC DoITT, AppGeo, Quantum Spatial, Land Cover Raster Data (2017) – 6in Resolution, 2017.
Food and Nutrition
Before the COVID-19 pandemic, about 1.1 million New York City residents experienced food insecurity.177Food Insecurity among overall (all ages) Population in New York. (2019). Feeding America. Nonprofit Organization. In 2020, business closures during the pandemic resulted in loss of income for many New Yorkers. The food-insecure population grew to about 1.6 million people, and the Bronx had the highest borough-wide food insecurity rate at 19.7 percent.178Food Insecurity among overall (all ages) Population in Bronx County. (2019). Feeding America. Nonprofit Organization. In the same year, 74 percent of food pantries and soup kitchens reported an increase in overall visitors from the previous year.179New Yorkers Don’t Live Single-Issue Lives: The Intersections of Hunger. (2020). Food Bank for New York City. Community Organization. Food insecurity continues to be a major issue in NYC. According to data from the NYC Health Department, more than one third of New York City adults, approximately 2.2 million people, lived in a household at risk for food insecurity in 2021.180Food Metrics Report 2022. (2021). NYC Mayor’s Office of Food Policy. NYC Government.
Today, Black and Hispanic or Latino communities disproportionately bear the burden of food insecurity and diet-related diseases such as high blood pressure and diabetes.181Community Health Survey—Prevalence for high blood pressure ever. (2017). NYC DOHMH. NYC Government., 182Community Health Survey—Prevalence for diabetes ever. (2017). NYC DOHMH. NYC Government., 183Community Health Survey—Prevalence whose household sometimes/often did not have enough food by race/ethnicity. (2017). NYC DOHMH. NYC Government. In particular, the South Bronx has the highest rate of high blood pressure (39 percent) citywide. Fordham-Bronx Park has the highest rate of diabetes (20.7 percent) citywide. Evidence suggests that food insecurity may exacerbate outcomes related to these diet- related chronic conditions.184Food insecurity and health outcomes. (2015). Gundersen, C. and Ziliak, J. Health Affairs, 34(11). Academic Research.
Poverty and food insecurity are inextricably connected, as limited household income can create barriers to accessing sufficient, healthy food. According to the NYC Poverty Measure, which accounts for the region’s elevated cost of living, 19 percent of the city residents are living in poverty.185Poverty Data Tool. (2019). NYC Mayor’s Office for Economic Opportunity. NYC Government. The Bronx experiences some of the city’s highest rates of poverty, particularly in Hunts Point, Melrose, and Longwood.186Poverty Data Tool. (2019). NYC Mayor’s Office for Economic Opportunity. NYC Government. Additionally, post-COVID inflation contributed to a 10 percent rise in at-home food prices in June 2022 from the year prior.187ENDNOTECOPY The Supplemental Nutrition Assistance Program (SNAP) can help close the gap for certain qualifying households; 19 percent of New York City households receive SNAP benefits with the plurality residing in East New York.188ENDNOTECOPY
While cost remains one of the biggest barriers to shopping for and preparing foods that are part of a healthy diet for people with low incomes, disparities in food environments also contribute to inequities in access to healthy and unhealthy food. An analysis revealed that predominantly Black areas had higher densities of fast-food establishments than predominantly white areas in New York City.189Inequality in obesigenic environments: Fast food density in New York City. (2009). Kwatea, N., Lohb, C., and Williams, D. Health & Place, 15(1). Academic Research. This racial disparity was consistent across income levels: high-income Black areas and low-income Black areas had similar densities of fast food. Ubiquitous marketing and product availability disproportionately promote unhealthy foods and make them easily accessible for purchase. Marketing for unhealthy foods is targeted to certain communities, which contributes to disproportionate exposure to unhealthy food advertisements in communities of color.190Reducing Predatory Marketing of Unhealthy Foods & Beverages in New York City Policy Options for Governments and Communities. (2022). CUNY Urban Food Policy Institute. Academic Institution.
In 2008, the Department of City Planning (DCP) developed the Supermarket Needs Index (SNI) to identify neighborhoods underserved by fresh food stores. Contributing data points include walkability, concentration of stores, household vehicle access rates, and poverty rates. Bedford-Stuyvesant and Sunset Park in Brooklyn, East Elmhurst and North Corona in Queens, and Mott Haven and Hunts Point in the Bronx are all examples of high need communities according to the 2018 index.191FRESH Food Stores. (2018). NYC DCP. NYC Government. In 2021, DCP expanded the Food Retail Expansion to Support Health Program (FRESH), a zoning incentives program that supports grocery stores in underserved neighborhoods, based on the SNI.192FRESH Food Store Update. (n.d.). NYC DCP. NYC Government. 193 NYCEDC manages a related tax incentive program to lower the costs of owning, leasing, developing, and renovating supermarkets in these areas.
Rising rents, narrow profit margins, and competition from online and specialty retailers have created difficulties for neighborhood-serving grocery store operators.193ENDNOTECOPY Between 2005 and 2015, the city lost around 8 percent of family-owned small grocery stores, placing additional strain on food access.194Where Did My Supermarket Go? (2016). Kaysen, R. The New York Times. News Article. These small but critical food stores can be difficult to capture within fresh food access data sets that rely solely on store footprint or gross sales.

Community Case Study
Crown Heights Mutual Aid
LOCATION: Crown Heights, Brooklyn
Formed in March 2020 in response to the burgeoning COVID-19 pandemic, Crown Heights Mutual Aid (CHMA) is a network of neighbors caring for each other in Crown Heights, Brooklyn. Based on a model of mutual support rather than of charity, CHMA quickly mobilized during the pandemic to help people meet their daily needs in a time of crisis, delivering supplies such as food and masks. The group has since grown into a sustaining mutual aid network that promotes not only food justice but also housing justice and educational equity.195
Home to Black, Hasidic Jewish, and Hispanic or Latino communities, Crown Heights faces multiple environmental injustices, including higher-than-average heat vulnerability and elevated numbers of emergency department visits for asthma.196,197 Over the decades, the neighborhood has shown great resilience in the face of adversity, including a bounce back from interracial violence in 1991 that erupted in response to a vehicle crash that killed a young Black boy.198 Now, as Crown Heights emerges from the COVID-19 pandemic and continues to gentrify, CHMA and other community organizations build neighborhood strength and capacity to face these challenges together.
access to Green Economic Opportunities
Building an equitable green economy requires the fair distribution of opportunities and investment to EJ communities. NYC’s green economy represents sectors and workers that directly and intentionally contribute to achieving the City’s climate goals. Historic federal, state, and local investment in sustainability and climate-driven work creates job opportunities across sectors including building decarbonization, renewable energy, transportation, resilience infrastructure, and green finance, among others. The City of Yes for Carbon Neutrality initiative supports the growth of this work locally by modernizing zoning regulations to accelerate grid infrastructure upgrades, energy storage installations, and climate resiliency improvements.
Notably, women and Black workers are typically underrepresented in the state’s clean energy workforce.199 City initiatives, like the New York City Economic Development Corporation (NYCEDC)’s ConstructNYC and the Offshore Wind Waterfront Pathways Programs, seek to foster greater diversity by helping Minority, Women-Owned, and Disadvantaged Business Enterprises (M/W/DBEs) access exclusive opportunities on NYCEDC projects.200 NYCEDC is also investing $10M across the City University of New York (CUNY) system to build the workforce training facilities, infrastructure, and the programming necessary to train the next generation of offshore wind talent.
Further building on these initiatives, NYCEDC, in partnership with the Mayor’s Office of Talent and Workforce Development (NYC Talent), developed the NYC Green Economy Action Plan to guide future investment and workforce initiatives for the city’s green sectors.

Bronx River Alliance Environmental Enrichment and Leadership (EELS) students
Reducing disparities in access to green economic opportunities will also require prioritized investment and engagement throughout the education to employment pipeline including efforts to increase exposure to sustainability concepts in K-12 education, community college partnerships, robust paid internship and apprenticeship opportunities, and upskilling and certificate programs for mid-career professionals. Another such program is Environmental Enrichment and Leadership for Students (EELS), run by the Bronx River Alliance. The 14-month paid internship program provides a chance for youth from underrepresented communities to engage in hands-on environmental education using the Bronx River as a living lab, all while earning college credits.
The growth of the green economy provides an exciting opportunity to rethink standard models of ownership to democratize access to resources. In New York City, access to rooftop solar can often face technical and economic challenges due to limited roof space and high installation costs. Community solar projects, such as Solar Uptown Now (SUN), help address this issue by allowing multiple households to purchase local solar power as a group. The project came out of a partnership with WE ACT, Solar One, CUNY, and the Urban Homesteading Assistance Board. Over 1,000 Upper Manhattan residents benefit from the project, which brought $61.7K in energy bill savings during the first year.201
Stakeholder Input
The following collection of quotes from the focus groups and interviews, conducted as part of the qualitative research for this report, speak to issues associated with fair access to resources.
Transit and Alternative Transportation Access
“I see people speeding through residential streets. There are no protected bike lanes in Downtown Flushing, so that means there’s no physical separation of bicyclists and car drivers, which creates problems.”
“If you go to Southeast Queens, like Richmond Hill, it’s a transportation desert, even though it is densely populated. People there need cars … I have a car because as a person of color who grew up in the city, my family was only able to settle in places far away, in the boroughs, that were not close enough to subway transportation.”
Open Space and Natural Resources
“There’s one huge park, Springfield Gardens, that has only four trash cans. In other parks, we see invasive species growing out of control to the extent that people feel unsafe in the parks … It is so important for there to be greater effort to provide park maintenance in the parks that people of color actually use in the city. It’s really demoralizing when people visit Central Park and see how that park is maintained, and then they go back to their parks and they see what that looks like.”
“We have a two-tiered parks system: Public/private partnerships exacerbate inequality, and challenges vary by organization and community.”
Food and Nutrition
“A lot of people are dealing with unhealthy soils; they can’t grow food there to eat, and therefore they cannot access healthy food. They are eating food that’s been trucked from far and wide.”
“Food sovereignty is also really important. We have a Latino community that is mostly Mexican, and I think it’s Mexican children that are leading in childhood diabetes and obesity.”
Next:Exposure to Polluted Air >>