This section focuses on exposure to polluted water across two issues and indicators: polluted water bodies and stormwater management. Drinking water is discussed in Access to Safe and Healthy Housing (p. 106). The findings point to opportunities for the City to invest in environmental justice communities and improve accountability through increased data transparency.
Water quality can be impacted by upstream contamination, stormwater and other runoff, legally permitted discharges, illegal sewer connections and dumping, combined sewer overflows, and both historical and present-day industrial pollution. Furthermore, many of New York City’s water bodies have been significantly altered (e.g., bulkheaded canals, loss of surrounding wetlands) and have no source of fresh water to flush out contamination.
Continuing to improve water quality in our coastal waters will benefit New York City’s EJ communities, and the city overall, by reducing risk of exposure to contaminants. Water quality improvements will also increase access to water recreation activities and swimming. The NYC Department of Environmental Protextion (DEP)’s CSO Long-Term Control Plan and green infrastructure investments will continue to make improvements in this area. Efforts to reintegrate species such as oysters, ribbed mussels, and eel grass into New York Harbor can also help clean and filter water, reconnecting New Yorkers to the biodiversity that once flourished.
key Findings
NYC has
14
miles of swimming beaches that serve around
7M
swimmers per year
Many of NYC’s waterways are suitable for boating. However, many of the waterways within and surrounding New York City are impaired or stressed and limited for swimming due to a number of factors including water quality, current, and boat traffic.
New York City areas most impacted by stormwater flooding include Southeast and Central Queens, North Staten Island, and Southeast Bronx.
![]()
Construction of New York City’s modern sewer system began in 1849 following a series of deadly cholera outbreaks, and it was largely built out by the beginning of the 20th century. Today, approximately 60 percent of New York City’s sewer system combines the flow of stormwater (water originating as precipitation), domestic sewage, and industrial wastewater in the same conveyance system. Combined sewer systems were designed to discharge excess flow to the waterways during excessive rainfall to prevent sewage backing up to homes and streets, and to protect wastewater resource recovery facilities from process upsets. Those discharges are called combined sewer overflows (CSOs). The occurrence of CSOs can restrict uses of the city’s water bodies such as fishing, swimming and recreation, and they can be harmful to anyone in direct contact with the discharge.
Other areas of the city are serviced by municipal separate storm sewer systems (MS4), which collect sanitary and stormwater flows in separate sewers; conveying sanitary flow to the wastewater treatment plant and conveying stormwater to discharge directly into New York Harbor and the other surface waters surrounding New York City.
While MS4s do not discharge untreated sewage into water bodies, they do collect pollutants as stormwater flows over streets and other impervious surfaces into storm sewers and that polluted stormwater discharges directly into local waterways, which can negatively impact water quality.
Both types of systems have limitations, and system failure can prove catastrophic. A notable 2019 sewer collapse in South Jamaica, Queens, a neighborhood comprised of predominantly Black and Hispanic or Latino homeowners, inundated the basements of 127 homes with raw sewage, posing threats to both human health and home values.397How a Sewage Flood Upended Lives in Queens. (2021). Closson, Additionally, in a few low-lying areas that historically lacked access to the city’s sewer infrastructure, residents rely on individual septic systems that require regular maintenance to prevent the release of untreated wastewater.
The compounding effects of climate change on New York City waterways and sewer infrastructure should not be underestimated. Coastal storm surge, high-tide flooding, and rising groundwater, all of which are predicted to increase with climate change, pose risks to the sewer system, namely corrosion from saltwater exposure and erosion, as well as backflow issues caused by rising tides blocking sewer outfalls.398New York City Stormwater Resiliency Plan. (2021). NYC Government.
Climate change impacts increase the risk of exposure to contaminated water and hazardous substances. During heavy rainfall and storm surge events, floodwaters may disturb contaminated sediments that leach pollutants and inundate areas where hazardous materials are stored. In response to concerns about hazardous chemical leaks during Hurricane Sandy, EJ organizers in Sunset Park produced a Business Resilience Toolkit with best practices to make auto shops and other industrial businesses resilient to flooding. The toolkit outlines steps to reduce potential exposure by elevating and securing storage containers, managing rain and flood waters, and other tactics.399Business Resilience Toolkit for Auto Salvage Shops. (2014). Grassroots Research to Action in Sunset Park (GRASP). Community Organization. Additional impacts from climate change are discussed in Exposure to Climate Change (p. 140).
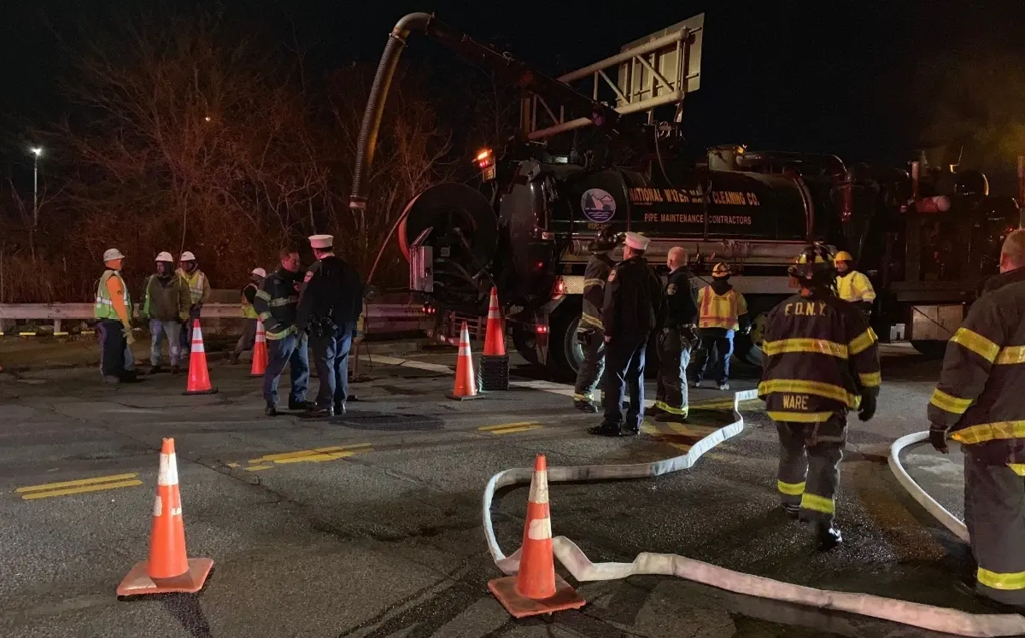
A clogged sewer line sent raw sewage flooding into the basements of dozens of homes in southeast Queens in December 2019.
Data Analysis
Polluted Water Bodies
While many waterfront neighborhoods are expensive places to live today, during the city’s industrial peak they were some of the least desirable areas due to pollution. Communities of color were driven to live in close proximity to polluted water bodies, due to systemic housing discrimination previously described. Waterfront EJ communities include those in the South Bronx, Brooklyn Navy Yard, Red Hook, Gowanus, Sunset Park, Staten Island’s West Shore, and the neighborhoods surrounding Newtown Creek and Kill Van Kull. The Gowanus Canal and Newtown Creek are home to U.S. EPA-designated Superfund sites, where hazardous waste is concentrated and must undergo cleanup as required by the Comprehensive Environmental Response, Compensation and Liability Act (CERCLA, also called Superfund). Note that both EJ and non-EJ areas are adjacent to these sites.
Community Case Study
Bronx River Restoration, Bronx River Alliance
LOCATION: Bronx
The Bronx River was once so clean that it was considered as a source for the City’s drinking water. But like other New York City waterways, since the 19th century the river has been heavily polluted by industrial use and sewer outflows. Today, the river is polluted by combined sewer overflows, trash, microplastics, and other pollutants originating in Westchester and the Bronx. These pollutants threaten the river’s ecology and hamper recreation opportunities. In partnership with the NYC Department of Parks and Recreation, the Bronx River Alliance works to advocate for, protect, restore, and engage with the community around the Bronx River in order to once again make it an ecologically healthy, publicly accessible space for communities in the Bronx and broader region.
As part of this work, the Bronx River Alliance uses citizen science to monitor, study, and restore the river’s ecology. The Alliance employs volunteers to study water quality at locations along the length of the river, monitoring for pollutants such as microplastics and bacteria that indicate raw sewage contamination. The volunteers also actively work to restore the river’s ecology; to date, they have removed over seven tons of trash from the river and are working to promote green infrastructure to alleviate stormwater and sewer runoff.401Restoring the Ecology. (n.d.). Bronx River Alliance. Community Organization.New York’s waterways were once teeming with wildlife and safe to swim in. Thanks in part to the efforts of groups such as the Bronx River Alliance, both wildlife and recreational opportunities are returning to New York City’s waterways. Healthy, clean rivers bring myriad health benefits such as the opportunity to cool off on hot days, which is becoming increasingly important as climate change exacerbates extreme heat.
Human exposure to water contaminants can be harmful, particularly the exposure to pathogens: disease-producing bacteria, viruses, and other microorganisms.400ENDNOTECOPY Poor water quality also degrades ecosystems, which affects human populations. For example, the deterioration of wetlands caused by new development and nutrient discharge reduces New York City’s ability to naturally absorb storm surge, which can contribute to flooding in nearby neighborhoods.
The largest (Tier 1) CSO outfalls, which discharge over 50 percent of total combined sewer overflow volume into local waterways, are located in the Bronx, Brooklyn, and Queens—the boroughs with the highest populations of low-income households and people of color, with 455 million gallons per year (mgy) of raw combined sewage entering the Bronx River, and 1,226 mgy entering Newtown Creek annually.402NYC Environmental Justice Agenda: Building Resiliency and Equity for a Just Transition. (2018). NYC-EJA. Community Organization. DEP has invested over $10 billion since 2002 to improve water quality, including $2.7 billion for CSO control infrastructure to reduce CSO discharges into these water bodies. The agency is proposing additional $6.2 billion in capital funding for CSO controls as part of the CSO Long-term Control Plan and has committed $3.5 billion for construction of green infrastructure across the city.
DEP monitors and reports on polluted water bodies in accordance with State regulations. As such, DEP reports on the presence of pathogens, floatables (artificial and natural debris), and the nutrients nitrogen and phosphorus, which in excess can cause algae blooms and aquatic weed growth to the detriment of water quality and ecosystem health. According to a 2020 DEP report, Jamaica Bay and the adjacent water bodies Hendrix Creek and Bergen Basin contain high levels of three of the four indicators (pathogens, floatables and nitrogen).403ENDNOTECOPY Two of the three indicators exceeded acceptable levels in the Bronx River, Coney Island Creek, Flushing Creek/Bay, and Spring Creek, which each abut EJ Areas.404ENDNOTECOPY Furthermore, DEP’s Floatables Monitoring Program identified sites that were consistently rated poor with respect to trash and debris from 2009 to 2018. They include the Gowanus Canal, Newtown Creek, and Coney Island Creek, which each abut EJ Areas, as well as Arthur Kill, Little Neck Bay, and Bergen Basin.405Floatables Monitoring Program Progress Report (2019). NYC DEP. NYC Government.
The NYS Department of Environmental Conservation (DEC) defines stressed water bodies as those that may be unable to support their designated best use due to water quality conditions water quality conditions. Impaired water bodies are defined by DEC as those that do not meet applicable water quality standards. State monitoring of New York City’s water bodies for recreational use, displayed in the map below, indicates that all water bodies surrounding the city are either impaired or stressed except the Atlantic side of the Rockaways. The impaired water bodies are more topographically restricted, shallow, and engineered—creating less free flowing water—than the Hudson River, Long Island Sound, and Atlantic Ocean. Major beaches and public access points are identified on the map.
Water Quality Assessment for Recreational Use
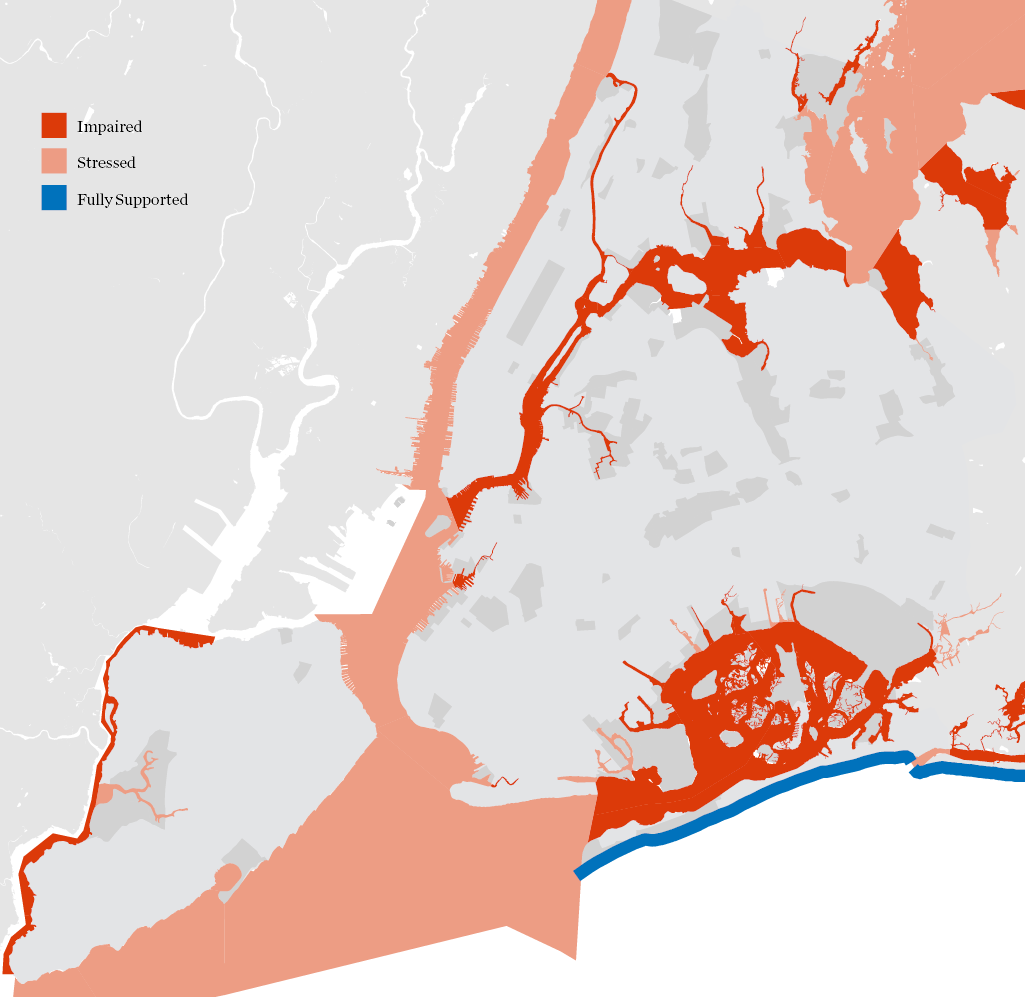
SOURCE: NYS Department of Environmental Conservation, Division of Water, Bureau of Water Assessment and Management, 2019.
Program/Policy Spotlight
Cso Long-term Control Plan
LEAD AGENCY: NYC Department of Environmental Protection (DEP)
In 2012, the Department of Environmental Conservation (DEC) and the DEP agreed to amend the Combined Sewer Overflow Consent Order to reduce combined sewer overflows using a hybrid green and gray infrastructure approach. Green infrastructure refers to the use of nature- based solutions such as curbside rain gardens and detention ponds to reduce stormwater runoff before it enters the sewers. Gray infrastructure involves the use of traditionally constructed solutions such as sewer pipes and storage tanks to address runoff. In accordance with the Order, DEP has developed water-body- specific Long Term Control Plans (LTCPs) to identify the appropriate controls necessary to achieve water quality standards consistent with the federal CSO policy and the Clean Water Act.
In the ten years since starting the development of the Long-Term Control Plans, over $600 million has been put towards grey infrastructure including installing new sewer lines and separating sanitary and stormwater flow, increasing the capacity at wastewater resource recovery facilities (WRRF) and improving treatment efficiency and reliability at these facilities, with more projects still in the design phase.4062022 Q4 CSO Quarterly Report. (2022). NYC DEP. NYCWithin the same period, over $1.15 billion has been spent on green infrastructure projects such as curbside rain gardens, street-length bioswales, and park and playground infiltration practices.407NYC Green Infrastructure Annual Report. (2022). NYC DEP. NYC Government.DEP has committed $3.5 billion (including investments already made) toward green infrastructure across the city.
An analysis of census tracts with constructed or planned grey infrastructure projects under the LTCPs showed that 50 percent are EJ Areas. Similarly, for green infrastructure projects within the LTCP drainage areas, 52 percent are in EJ Areas; with the benefiting population made up of 16 percent Asian or Pacific Islander, 22 percent Black, 31 percent Hispanic or Latino, and 28 percent White residents. As such, EJ Areas receive an equitable share of the stormwater flood mitigation, air quality, and urban heat mitigation benefits provided by the grey and green infrastructure investments.408The climate benefits, co-benefits, and trade-offs of green infrastructure: A systemic literature review. (2021). Choi, C., Berry, P., and Smith, A Journal of Environmental Management, 291. University of Oxford. Academic Research.
Long Term Control Plan Investments per Acre
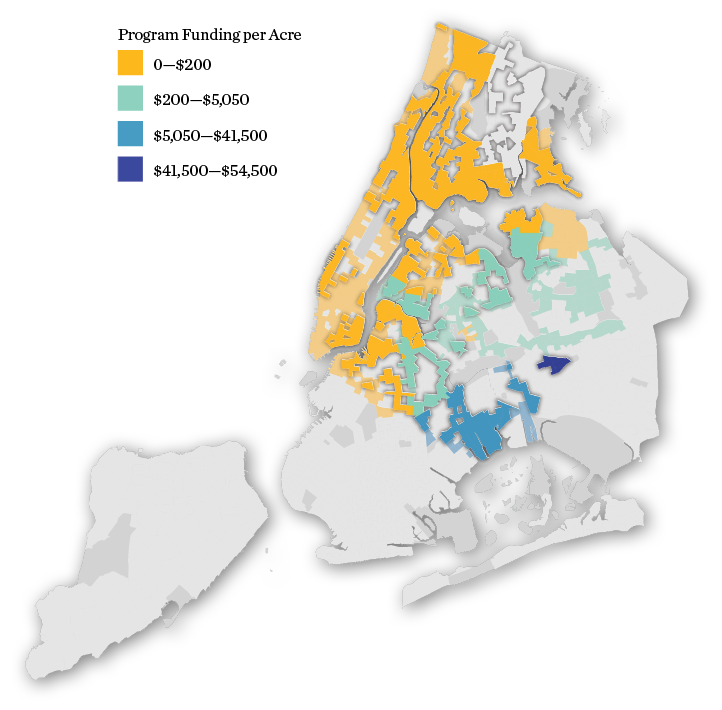
SOURCE: NYC Department of Environmental Protection DEP – Bureau of Environmental Planning and Analysis, Combined Sewer Outfalls, 2022; CSO Order on Consent – Quarterly Progress Report, 2022. NYS Department of Environmental Conservation, Disadvantaged Communities Criteria, 2023.
Stormwater Management
Consistent with State and federal guidelines, New York City’s sewer system is largely designed to collect and convey water that falls as precipitation up to the level of a five-year storm (i.e., 1.75 inches of rainfall per hour for a one-hour storm; with a 20 percent chance of occurring in any year given historic rainfall data). When stormwater exceeds the capacity of sewers, particularly if the top of catch basins (i.e., the gratings) are covered with leaves or other debris, ponding and flooding of streets can occur. Building owners are responsible for keeping the top of catch basins clear. Chronic local flooding issues can impact quality of life, housing stability, and pose serious accessibility issues for residents with mobility impairments. Standing water can serve as a breeding ground for mosquitoes, which in turn can carry disease to nearby residents.
Stormwater flooding in New York City depends on hyperlocal conditions and can occur quickly. However, areas that are low lying and have less green space may be particularly at risk.409New York City Stormwater Flood Maps (2021). City of New York. NYC Government., 410Cool Neighborhoods NYC (2017). City of New York. NYC Government. Many factors make some areas vulnerable: local topography, historic stormwater flow paths (including historic streams that were covered or filled), subsurface conditions, land use, and impervious surfaces such as asphalt. Areas of New York City most impacted by stormwater flooding include Southeast and Central Queens, North Staten Island, and Southeast Bronx.
The borough of Staten Island receives the most investment per capita in sewer and water infrastructure, partly due to its lower housing density as well as the need to maintain the novel Bluebelt system on the island. The Bluebelt improves localized flooding and stormwater management by preserving and enhancing natural drainage corridors. The Bluebelt has proven to be beneficial to the sections of Staten Island it serves, but it does not include the EJ Areas on the island which contain fewer historic wetlands.
Areas of New York City Most Impacted by Stormwater Flooding Include Southeast and Central Queens, North Staten Island, and Southeast Bronx.
MOCEJ is developing a Climate Vulnerability, Impact, and Adaptation Analysis (VIA), which will bring together scientific and local information on social and economic vulnerability, public health, and climate change to inform policy and action for communities most vulnerable and at-risk, and to understand the opportunities and tradeoffs from various mitigation and adaptation strategies. This analysis will support the City’s efforts to advance data transparency with the aim of improving accountability and community advocacy. Exposure to Climate Change (p. 140) contains more information on stormwater flooding and the associated climate change projections.
During severe wet weather events, combined sewers or sanitary sewers that have stormwater connections can exceed their design capacity and contribute to sewer backups. Wet weather events can exacerbate detrimental sewer conditions that lead to sewer backups. Such conditions include improper disposal of wipes (wipes should never be flushed, all wipes should be tossed in the trash) and grease (grease should not be poured down the drain, it should be frozen and then placed in the trash, and paper towels should be used to wipe grease and oil of dishes before washing).
Seven of the top ten neighborhoods with the most confirmed sewer backup complaints reported to 311 in 2022 are EJ Neighborhoods.viiiThis analysis accounts only for confirmed sewer backup complaints to 311. Sewer backup complaints can be confirmed upon investigation or unconfirmed. Of those confirmed, some are attributed to a defective sewer, rain intensity or volume, and others as potentially due to a building plumbing issue. Citywide, Black New Yorkers are overrepresented within areas that have a greater than average number of confirmed sewer backup complaints. As previously mentioned in Hazardous Material Incidents section (p. 103), complaint data is inherently biased and may underrepresent EJ communities and is used here as a proxy indicator.
Through its Green Infrastructure Program, DEP has introduced a wide range of practices across the city that use or mimic natural systems to manage stormwater runoff. Green infrastructure can improve local drainage and help reduce combined sewer overflow by capturing stormwater before it enters the sewer system. By increasing vegetation and tree cover, green infrastructure projects also have air quality benefits and by helping to manage local stormwater conditions can enhance climate resiliency.411Benefits of Green Infrastructure. (2023). US EPA. US Government. Examples of green infrastrucutre practices include rain gardens, green and blue roofs, infiltration basins, and porous pavement. When normalized by land area, seven out of the top ten neighborhoods receiving investments from DEP’s Green Infrastructure Program are EJ Neighborhoods in Brooklyn and Queens.
Top 10 Neighborhoods with the Most Confirmed Sewer Backup Complaints
| NEIGHBORHOOD (NTA) | NUMBER OF 311 SEWER BACKUP COMPLAINTS IN 2022 | PERCENTAGE OF CENSUS TRACTS CLASSIFIED AS AN EJ AREA |
|---|---|---|
|
Woodlawn-Wakefield, BX |
67 |
44% |
|
South Jamaica, QN* |
53 |
76% |
|
Jamaica, QN* |
48 |
89% |
|
Schuylerville-Throgs Neck-Edgewater Park, BX* |
42 |
97% |
|
Far Rockaway-Bayswater* |
39 |
56% |
|
Park Slope-Gowanus, BK |
38 |
11% |
|
Williamsbridge-Olinville, BX* |
37 |
89% |
|
Bay Ridge, BK |
32 |
6% |
|
Pelham Bay-Country Club-City Island, BX* |
30 |
57% |
|
Crown Heights North, BK* |
30 |
83% |
*EJ Neighborhood.
SOURCE: NYC Department of Environmental Protection, 2022.
Top 10 Neighborhoods with the Highest Density of Completed Green Infrastructure Projects
| NEIGHBORHOOD (NTA) | COMPLETED GREEN INFRASTRUCTURE PROJECTS PER ACRE | PERCENTAGE OF CENSUS TRACTS CLASSIFIED AS AN EJ AREA |
|---|---|---|
|
East Flatbush-Farragut, BK |
1.22 |
6% |
|
Rugby-Remsen Village, BK* |
0.84 |
60% |
|
Prospect Lefferts Gardens-Wingate, BK |
0.71 |
21% |
|
Brownsville, BK* |
0.68 |
100% |
|
Canarsie, BK |
0.68 |
15% |
|
Cypress Hills-City Line, BK* |
0.66 |
100% |
|
East New York, BK* |
0.65 |
100% |
|
Woodhaven, QN* |
0.62 |
50% |
|
South Ozone Park, QN* |
0.49 |
67% |
|
Ocean Hill, BK* |
0.44 |
100% |
*EJ Neighborhood
SOURCE: NYC Department of Environmental Protection, 2022.
Confirmed Sewer Backup Complaints
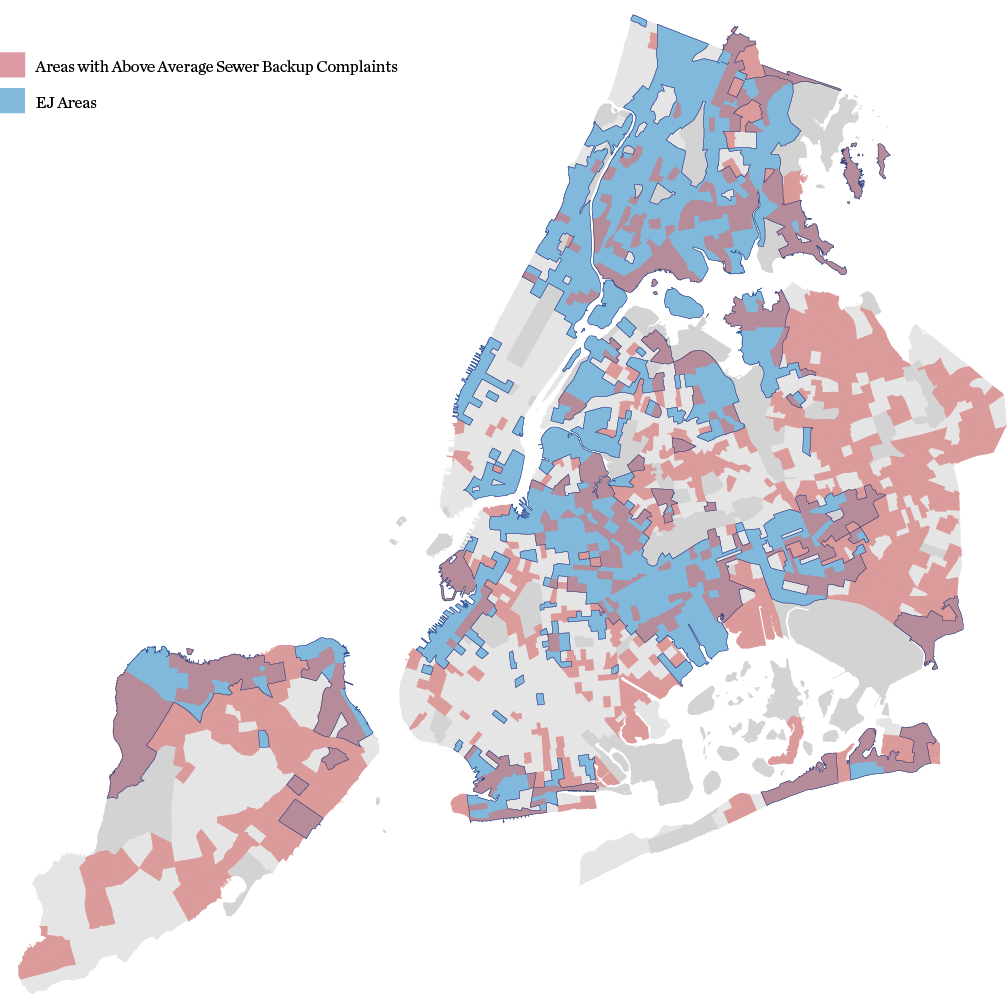
Demographics of Neighborhoods with Sewer Backup Complaints
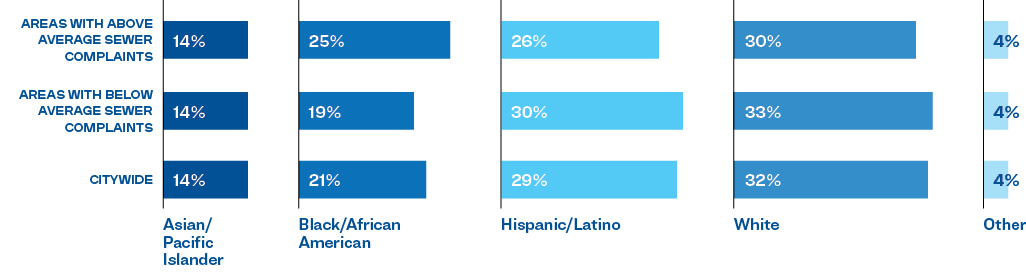
SOURCE: NYC Department of Environmental Protection, 2022. US Census Bureau, American Community Survey, 2017-2021 5-Year Estimates. NYS Department of Environmental Conservation, Disadvantaged Communities Criteria, 2023
Stakeholder Input
The following collection of quotes from the focus groups and interviews, conducted as part of the qualitative research for this report, speak to some of the water quality issues EJ communities face in New York City.
Polluted Water Bodies
“Water quality for us includes floatable garbage in the River. One of the three major water quality impairments on the Bronx River is floatables.”
Stormwater Management
“There has been a dearth of attention [on] Southeast Queens. Over Thanksgiving weekend in 2019, there was a sewage backup and hundreds of households were affected. These homes had raw sewage in their basements due to a failure of the City’s infrastructure, and their recovery process was really difficult.”
Next:Exposure to Climate Change >>