This section focuses on exposure to climate change across four hazards: extreme heat, coastal storm surge, chronic tidal flooding, and extreme rainfall. The findings point to opportunities for the City to invest in environmental justice communities, integrate environmental justice in agency decisions through climate budgeting, improve accountability through increased data transparency, and explore and develop new ways to collaborate with environmental justice communities.
Climate change has the potential to amplify the effects of environmental injustice. The 2019 report from the New York Panel on Climate Change (NPCC) explains that preexisting social and economic challenges combined with the uneven distribution of climate change impacts can make certain communities more vulnerable than others.412 Often, this means low-income communities and communities of color are affected first and worst by climate change. Disparities in access to essential services or environmental benefits can impact the ability of these same communities to withstand the shocks and stresses of climate hazards. Understanding the intersection of environmental justice issues and climate change is a necessary step toward building an equitable adaptation and resilience strategy. This chapter explores the exposure of New York City’s EJ Areas to climate change with a focus on extreme heat, extreme rainfall, coastal storm surge, and chronic tidal flooding.
Key Findings
Black New Yorkers are
2x
more likely to die from heat stress as white New Yorkers
Black residents are also less likely to have access to functioning air conditioning, the most effective way to prevent heat-health impacts.
![]()
![]()
If EJ Areas remain the same, current hazard forecasts for the 2080s suggest that this disproportionate exposure to coastal flooding and chronic tidal flooding could persist. EJ Area residents constitute:
58%
of the population living in the 2080 100-year coastal floodplain and
60%
of the population living within the 90th percentile projection of chronic tidal flooding for 2080siWhereas the 2020s stormwater flooding scenario is for a Moderate Stormwater Flood, the 2080s scenario is for an Extreme Stormwater Flood. As such, a direct comparison cannot be drawn between these scenarios.
Climate Change Overview
Climate change is an ongoing and urgent challenge that is profoundly impacting the lives of New Yorkers, from extreme weather events to gradual environmental changes. This environmental shift includes rising average temperatures, more extreme heat events, more frequent and severe flooding due to coastal storms and rising sea levels, and intensified inland flooding caused by extreme rainfall. These climate transformations not only jeopardize health and safety, leading to adverse outcomes such as fatalities and illnesses, but also result in economic losses for homes and businesses, and inflict damage upon neighborhoods. Climate change disproportionately burdens and impacts communities of color and low-income residents, who have been made more vulnerable due to generations of systemic racism, disinvestment, and inequality.
Data Analysis
Extreme Heat
Extreme heat is the top extreme weather-related cause of death in New York City and nationwide.413ENDNOTECOPY, 414Storm Events Database. (2022). National Oceanic and Atmospheric Administration. US Government. Extreme heat events are determined by the heat index, which is what the temperature feels like to the average person when relative humidity and air temperature are combined. In New York City, an extreme heat event, or heat wave, is defined as two or more days with a heat index reaching 95 degrees Fahrenheit (°F), or one or more days reaching 100°F. From 2016 to 2020, there was an annual average of 17 days with temperatures over 90°F, and 11 extreme heat events.4152023 NYC Heat-Related Mortality Report. (2022). NYC DOHMH. NYC Government., 41690 Degree Day Information at Central Park (1869 to Present). (2021). National Weather Service. U.S. Government. In an average year in the 2030s, there are projected to be up to three times as many days with temperatures over 90°F and up to nearly four times as many heat waves as there have been in the recent past.417ENDNOTECOPY New York City’s vulnerability to extreme heat events are exacerbated by the Urban Heat Island Effect (UHIE), a phenomenon that can lead to cities being up to 22 F hotter than rural and suburban areas due to the relate amount of dark, impervious surfaces, limited vegetation, and dense human activity.418Cool Neighborhoods NYC. 2017. NYC Government.
Prolonged exposure to heat can cause heat rashes, heat stress, heat exhaustion, and heat stroke. Even moderate heat days can pose health risks; almost two-thirds of annual heat mortality in New York City is associated with moderate heat.419ENDNOTECOPY Populations most at risk of severe heat-related illness or death in NYC include people who do not have or cannot afford to run air conditioning and have other vulnerability factor(s), such as a physical health condition (e.g. heart or kidney disease and diabetes); mental health conditions; dementia; take medications that affect thermoregulation; older adults; or those with conditions that affect their mobility.420ENDNOTECOPY People who are regularly exposed to the elements, such as outdoor workers and people experiencing homelessness, also face increased risk of heat-related illness. Recent studies have shown that heat exposure during pregnancy is associated with pre-term birth, reduced birth weight, and still birth.421Associations between high temperatures in pregnancy and risk of preterm birth, low birth weight, and stillbirths: systematic review and meta-analysis. (2020). Chersich M., et al. BMJ, 371. Academic Research.
On average, there were 683 heat-related illness emergency room visits each year in New York City from 2017 to 2022.422Real-time heat-related illness. (2023). NYC DOHMH. Environment and Health Data Portal. NYC Government. These hospital visits can be costly, particularly for the over half million New Yorkers living without health insurance.423ENDNOTECOPY Extreme heat also can worsen symptoms of pre-existing chronic conditions that can lead to increases in hospital visits and even death, known as heat- exacerbated death. Using weather and natural cause death data from 2011 to 2020, the NYC Department of Health and Mental Hygiene(DOHMH) estimates that an average of 350 heat-related deaths occur each summer and that these deaths have been increasing in the most recent decade, likely as a result of climate change and a recent plateau in the levels of air conditioning ownership.427ENDNOTECOPY
Key Terms424
Exposure The presence of people; livelihoods; environmental services and resources; infrastructure; or economic, social, or cultural assets in places that could be adversely affected because they are exposed to a hazard.
Hazard The potential occurrence of a natural or human-induced physical event or trend that may cause loss of life, injury, or other health impacts, as well as damage and loss to property, infrastructure,
livelihoods, service provision, ecosystems and environmental resources.
Impact The effects of climate change on natural and human systems.
Risk The estimated impact that a hazard would have on people, services, facilities, and structures in a community. Risk measures the likelihood of a hazard occurring and resulting in an adverse condition that causes injury or damage. Risk is often expressed in relative terms such as a high, moderate, or low. Risk also can be expressed in terms of potential monetary losses associated with the intensity of likelihood of sustaining damage above a particular threshold due to occurrence of a specific type of the hazard.
Vulnerability The characteristics of a person or group and their situation that influences their capacity to anticipate, cope with, resist, and recover from the adverse effects of physical events.
Community Case Study
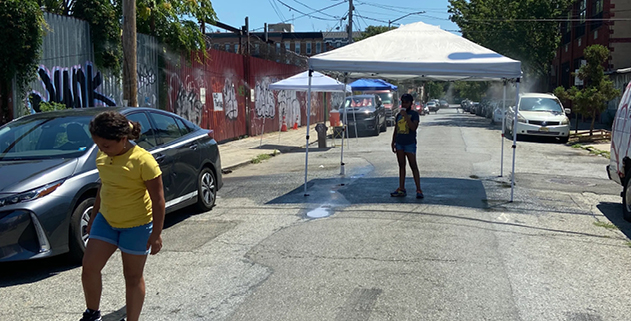
Cool Streets Red Hook
LOCATION: Red Hook, Brooklyn
In the sweltering summer months of 2020, when COVID-19 was in full swing and people had limited access to indoor cooling spaces, the Cool Streets initiative in Red Hook aimed to provide quick build solutions to cool people down. An initiative of Resilient Red Hook, the RETI (Resilience, Education, Training, and Innovation) Center, and Columbia University’s Center for Resilient Cities, Cool Streets brought together volunteers to build shade structures, benches, misting stations, and other interventions to keep community members safe during summer heat waves.425Communities Step Up to Keep Neighbors Safe from Extreme Heat and COVID-19. (2020). Kornfeld, M. and Belle, A. Yes Magazine. News Article.
Heat-related deaths are disproportionately concentrated in Black neighborhoods and low- income neighborhoods. Many parts of Red Hook have higher-than-average temperatures, particularly the areas around the Gowanus Expressway, some of which are low-income Black and Hispanic or Latino communities. These sorts of communities were among the hardest hit by the COVID-19 pandemic and among the least likely to have access to air conditioning at home.426Heat and Cooling Equity. (n.d.) NYC City Council. NYC Government.By providing COVID-safe, outdoor cooling infrastructure, initiatives such as Cool Streets Red Hook aimed to alleviate racial health disparities related to the compounding problems of extreme heat and COVID-19. As climate change increases the number of extreme heat days, these sorts of interventions will be all the more crucial to ensuring that New Yorkers are safe from the heat.
Access to home air conditioning is the most effective way to prevent disease and death due to heat exposure. Indoor temperatures can be much higher than outdoor temperatures, even at night, without access to proper cooling.428The Harlem Heat Project: A Unique Media-Community Collaboration to Study Indoor Heat Waves. (2018). Van-Hull, B., Ramamurthy, P., Havlik, B., Jusino, C.,et. al. Bulletin of the American Meteorological Society, 99(12). Academic Research. 91 percent of households citywide report having functioning air conditioning in the home.429Households reporting air conditioning. (2017). NYC DOHMH. Environmental Health and Data Portal. NYC Government. However, access is lower in neighborhoods with a higher prevalence of poverty and not all air conditioner owners can afford the increased energy costs of running the unit. A study of air conditioning access in New York City found that financial barriers contribute to lower access to home air conditioning amongst Black residents and individuals with a household income of less than
$30,000 per year.430Awareness, Risk Perception, and Protective Behaviors for Extreme Heat and Climate Change in New York City. (2018). Madrigano, J., Lane, K., Petrovic, N., Ahmed, M., Blum, M., and Matte, This is a contributing factor to inequities in heat-related health impacts: Black New Yorkers are twice as likely to die from heat stress than white New Yorkers.431ENDNOTECOPY
DOHMH and Columbia University’s NYC Heat Vulnerability Index (HVI) shows neighborhoods whose residents are more at risk for dying during and immediately following extreme heat. It uses a statistical model to summarize the most important social and environmental factors that contribute to neighborhood heat risk. The factors included
in the HVI are surface temperature, green space, access to home air conditioning, and the percentage of residents who are low-income or non-Latinx Black. 432Interactive Heat Vulnerability Index. (n.d.). Environment and Health Data Portal. NYC DOHMH. NYC Government. Differences in these risk factors across neighborhoods is rooted in past and present racism.433How Decades of Racist Housing Policy Left Neighborhoods Sweltering. (2020). Plumer, B. and Popovich, N. The New York Times. News Article. The majority of the population living in neighborhoods with high heat vulnerability (HVI-5 and HVI-4) live in EJ Areas, particularly within Central Brooklyn, Upper Manhattan, Southeast Queens, and the Bronx.
Heat Vulnerability of EJ Neighborhoods
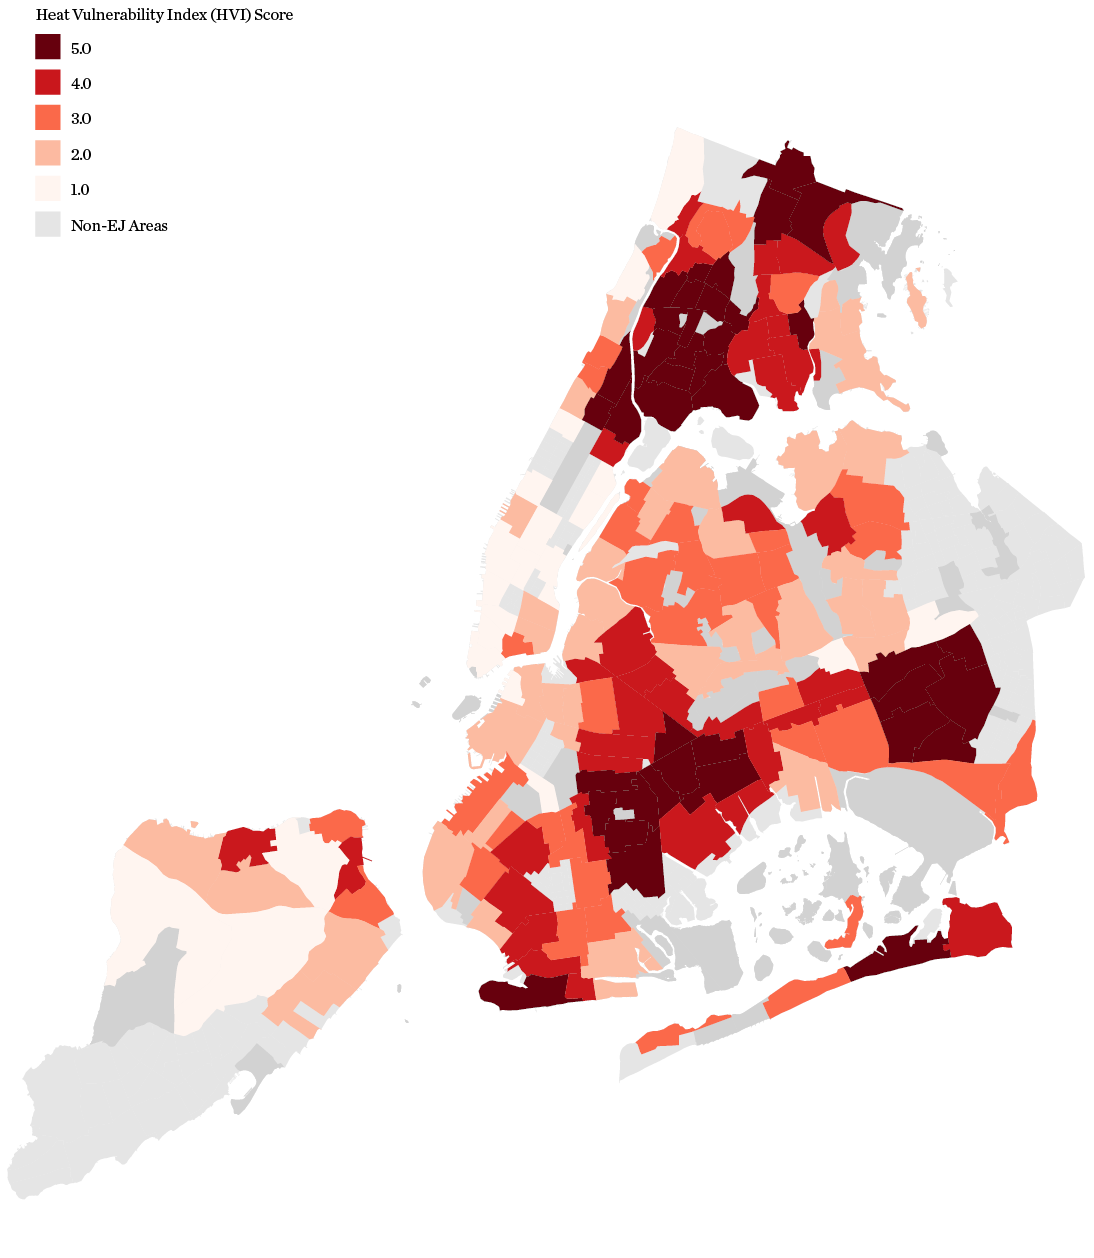
SOURCE: NYC Department of Health and Mental Hygiene, Environment & Health Data Portal, Heat Vulnerability Index (NTA), 2023. NYS Department of Environmental Conservation, Disadvantaged Communities Criteria, 2023.
Program/Policy Spotlight
Cool Neighborhoods NYC
LEAD AGENCIES: NYC Department of Parks and Recreation (NYC Parks), Department of Health and Mental Hygiene (DOHMH), and Mayor’s Office of Climate and Environmental Justice (MOCEJ)
As climate change and the urban heat island effect cause increasingly frequent periods of extreme heat, the risk of adverse health impacts such as dehydration, heat exhaustion, heat stroke, and mortality increases. In response, Cool Neighborhoods NYC was launched in 2017 as a $106 million program aiming to address extreme heat concerns in New York City. 434Cool Neighborhoods NYC. (2017). NYC Mayor’s Office. NYC Government.In Fall 2022, Mayor Adams announced an additional $112 million allocation to further expand the City’s tree canopy and support other strategies to address heat.435Press Release: NYC Parks Marks Climate Week with Suite of Tree Canopy Announcement and Expansion Efforts to Mitigate the Effects of Excessive Heat. (2022). NYC Parks. NYC Government.
A major initiative under Cool Neighborhoods NYC is the Be a Buddy model, which promotes social resilience through local volunteer networks. Participating community-based organizations identify heat-vulnerable residents and train local volunteers to perform wellness checks.436Be A Buddy (2022). NYC MOCEJ. NYC GovernmentThese networks were also activated at the height of the COVID-19 pandemic, with over 11,000 check-ins performed from March to August of 2020. By facilitating social cohesion within local communities, this program improves quality of life and advances environmental justice. Be a Buddy volunteers reported having an increased number of local relationships and feeling more supported and appreciated by their community upon participating in the program.
Cool Neighborhoods NYC also activated an interagency collaboration between the NYC Parks Department, the Mayor’s Office of Climate and Environmental Justice, and the Department of Health and Mental Hygiene, which initiated street-level temperature monitoring on a subset of city blocks. Targeted within some of the neighborhoods with the highest heat mortality risk, these agencies sought to obtain more accurate temperature data for mitigation and resilience planning.437Hyperlocal Temperature Monitoring. (2019). NYC DOHMH. NYC Government.Notably, there was no temperature monitoring in Staten Island. 75 percent of all monitored census tracts are EJ Areas, with Black residents making up majority of the population at 49 percent, followed by Hispanic or Latino residents at 29 percent. Additionally, 23 percent of residents in the monitored neighborhoods live below the federal poverty level.
In addition to these initiatives, the participating agencies have been advocating for the expansion of utility costs under the NYS Home Energy Assistance Program (HEAP) to include electricity costs for air conditioning during hot weather. In 2016, 65% of HEAP funding was allocated to heating assistance, while only 1% was directed towards cooling assistance (with the remainder going towards crisis assistance, weatherization, and administration costs). Cooling assistance funding could only be used for equipment purchases, with no support available to offset the prohibitive energy costs of running an air conditioner during hot weather.438Cool Neighborhoods NYC. (2017). NYC Mayor’s Office. NYC Government.Access to air conditioning during extreme heat events is a life-saving resource and a necessary tool towards advancing environmental and climate equity.
Population by Neighborhood Heat Vulnerability Index (HVI) Score
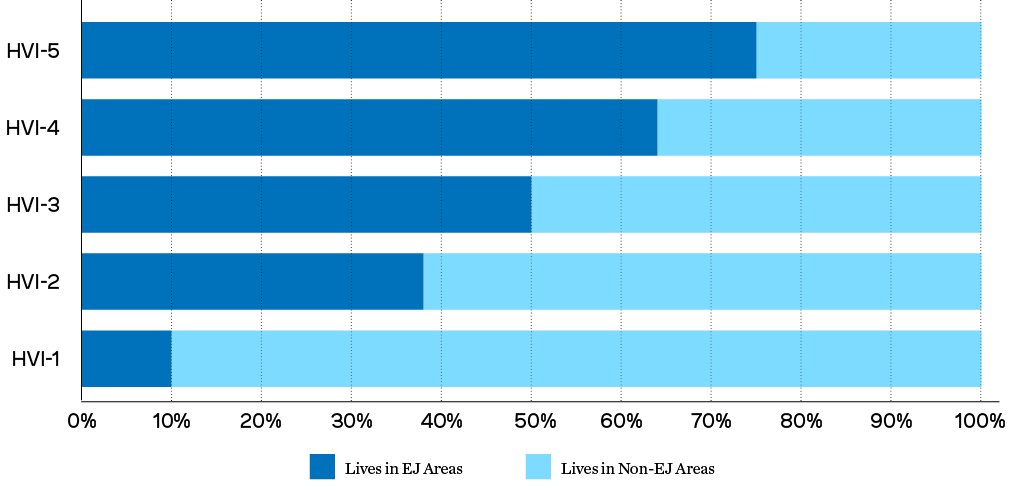
SOURCE: NYC Department of Health and Mental Hygiene, Environment & Health Data Portal, Heat Vulnerability Index (NTA), 2023. NYS Department of Environmental Conservation, Disadvantaged Communities Criteria, 2023.
Coastal Storm Surge
Coastal storm surge is an abnormal rise in sea level generated by a tropical or winter storm that causes water to rush onto land. Warming ocean temperatures due to climate change will increase the frequency and intensity of tropical storms in the Northeast.439New York City’s Risk Landscape: A Guide to Hazard Mitigation: Coastal Storms. (2019). NYCEM. NYC Government. Coastal storm surge combined with sea-level rise can produce devastating effects. Since 1900, sea levels in New York City have risen by a foot and are expected to increase by as much as 5.4 feet by 2100, leading to an increased frequency and intensity of coastal flooding.440ENDNOTECOPY Coastal communities are the most exposed to storm surge. 57 percent of the population living within the projected 2020s 100-year coastal floodplain live within EJ Areas, and 58 percent of residents living in the projected 2080s 100-year coastal floodplain live in EJ Areas.
Chronic Tidal Flooding
Sea level rise leads to higher tides, increasing the frequency of tidal flooding. Tidal flooding, also known as sunny-day or nuisance flooding, occurs when low-lying areas off the coast are inundated with water absent a storm event. While less severe than coastal storm surge, tidal flooding can still inflict significant property damage, disrupt mobility, and impact quality of life.
Some New Yorkers in coastal communities already experience regular tidal flooding, and it will increase in frequency and severity as sea level continues to rise. The average number of tidal flood days in New York City nearly doubled from 32 days from 1955-1984 to 63 days from 1985-2014.441Advancing Tools and Methods for Flexible Adaptation Pathways and Science Policy Integration. (2019). New York City Panel on Climate Change. Annals of the New York Academic of Sciences. By the 2080s, large portions of some coastal neighborhoods, such as communities around Jamaica Bay, could experience tidal flooding more than every other week on average.442PlaNYC: Getting Sustainability Done. (2023). NYC MOCEJ. NYC Government. 69 percent of the population living within the 90th percentile projection of chronic tidal flooding for the 2020s live in EJ areas, and 60 percent of the population living within the 90th percentile projection of chronic tidal flooding for the 2080s live in EJ areas.
Projected Storm Surge Inundation (2020s and 2080s)

SOURCE: NYC Mayor’s Office of Climate and Environmental Justice (formerly the Mayor’s Office of Long-Term Planning and Sustainability), Sea Level Rise Maps (2020s 100-year Floodplain), 2021; Sea Level Rise Maps (2080s 100-year Floodplain), 2021. NYS Department of Environmental Conservation, Disadvantaged Communities Criteria, 2023.
Chronic Tidal Flooding (2020s and 2080s)
Tidal flooding areas show tidal flooding expected with 90th percentile projections for sea level rise for the 2020s and 2080s.
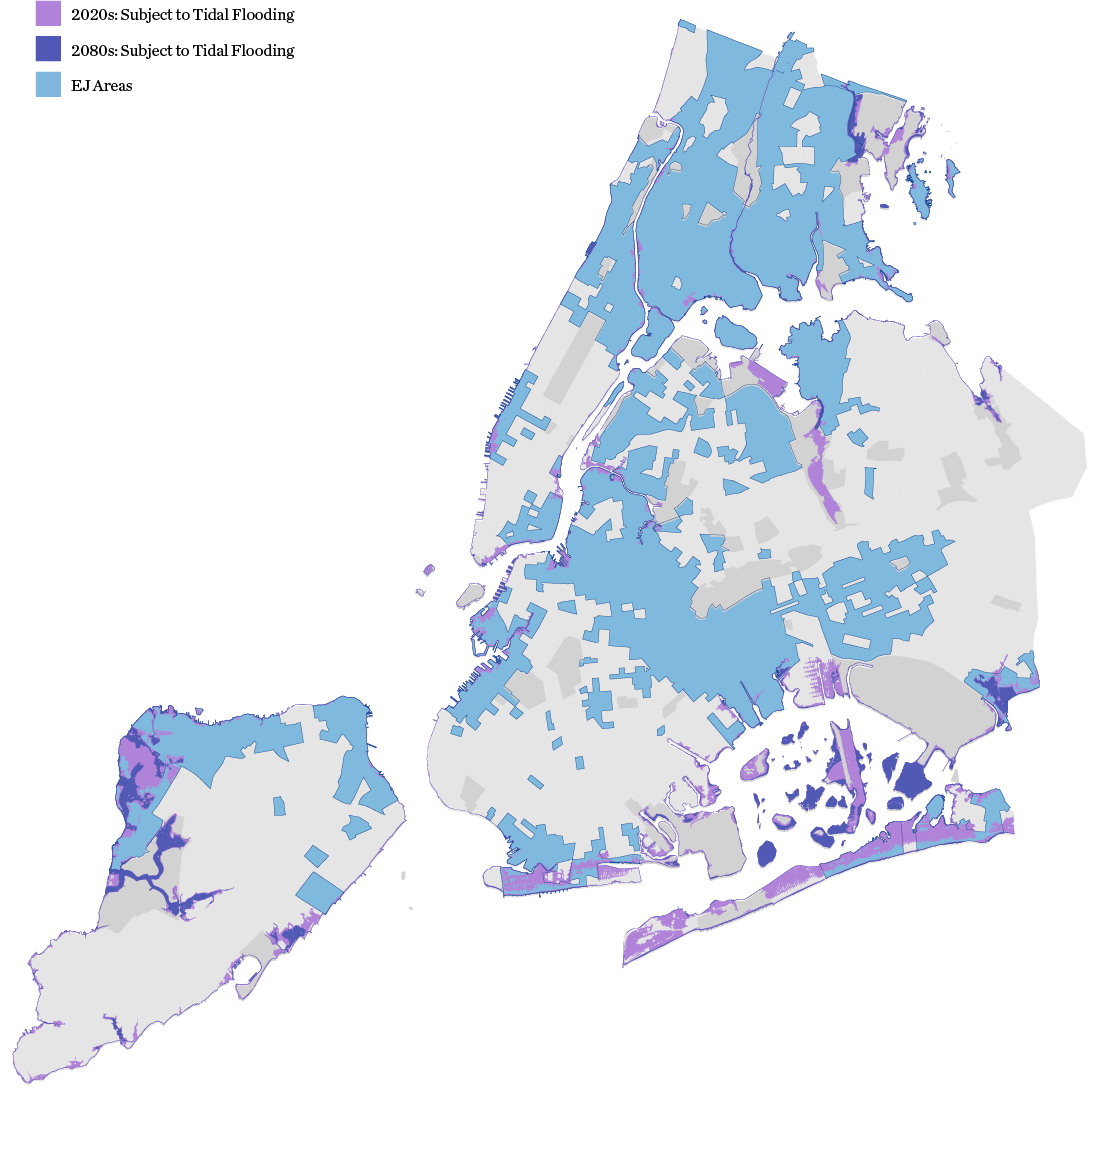
SOURCES: New York City Panel on Climate Change, Future Tidal Flooding Due to Sea Level Rise, 2018. NYS Department of Environmental Conservation, Disadvantaged Communities Criteria, 2023.

Two Queens residents clean their flooded basement-level apartment after heavy rains from storm Ida caused flooding.
Community Case Study
Flooding, Waterborne Disease, and Basement Apartments in Queens
LOCATION: Queens
During and after Hurricane Ida, residents in Queens were exposed to waterborne diseases such as norovirus and E. coli after flood waters possibly contaminated with raw sewage rushed into their homes. At least one person had to be hospitalized potentially due to waterborne disease.443ENDNOTECOPYResidents of basement apartments, mostly in Queens and Brooklyn, were among the hardest hit by flooding. In Woodside, Queens, a family of three, including a two-year old child, was killed when their basement apartment flooded.444ENDNOTECOPYThe compounding issues of flooding, unsafe housing, and sewage infrastructure in need of repair reached a crisis point during Hurricane Ida, at the expense of some of the city’s most marginalized residents.
Basement apartments are one of the few types of unsubsidized affordable housing in many New York City neighborhoods, but not all of them are up to code. Chhaya Community Development Corporation’s BASE (Basement Apartments Safe for Everyone) campaign aims to increase access to affordable, climate-safe, legally recognized basement apartments. The BASE campaign endeavors to find ways to formalize existing basement apartments so that they meet safety regulations and seeks to create pathways for unoccupied basements to be converted to safe accessory dwelling units. Chhaya envisions the potential for an additional 200,000 housing units from safe basement apartments, increasing both the affordability and resilience of the city’s housing stock.445BASE Campaign. (n.d.). Chhaya CDC. Community Organization.
extreme Rainfall
New York City is projected to experience more extreme rainfall in the mid and late-century. Annual rainfall may increase more than 20 percent by the end of the century.446Advancing Tools and Methods for Flexible Adaptation Pathways and Science Policy Integration. (2019). New York City Panel on Climate Change. Annals of the New York Academic of Sciences. A short-term extreme rain event, also known as a cloudburst, can unleash intense volumes of water onto the city. This excess water can overwhelm the City’s existing stormwater drainage system and result in severe flooding. Extreme rainfall can also trigger combined sewer overflows which send sewage, industrial waste, and other pollutants into the city’s waterways. Similar to flooding caused by coastal storm surge and tidal events, stormwater flooding can inflict significant damage on homes, businesses, and infrastructure.
As part of the 2021 Stormwater Resiliency Plan, the NYC Department of Environmental Protection (DEP) created a series of Stormwater Flood Maps that identify communities exposed to moderate and extreme stormwater flooding. The Stormwater Flood Maps are a powerful resource that visualizes publicly accessible flooding data and projections to enable more informed decision-making by residents, property owners, and policy makers. Neighborhoods in low-lying areas are most impacted by extreme rainfall, such as those in Southeast Queens, North Brooklyn, and the East Shore of Staten Island. 54 percent of the population living within areas subject to potential flooding under the 2020s Moderate Stormwater Flood with Current Sea Levels scenario live in EJ Areas. 48 percent of the population living within areas subject to potential flooding under the Extreme Stormwater Flood with 2080 Sea Level Rise scenario live in EJ areas. Note these scenarios represent different flood events and cannot be compared directly.
The City’s Stormwater Flood Maps are modeled data that rely on certain assumptions, including a uniform rainfall rate across the city, and assumptions that larger properties such as airports will manage drainage on site, and that the drainage network is free of debris or sediment and is functioning properly.447New York City Stormwater Flood Maps. (2021). NYC DEP. NYC Government.
Vulnerability, Impact, and Risk
Measuring climate vulnerability, risk, and impacts is complicated due to the interconnected nature of climate change. Current available research provides a general understanding of the potential impacts, such as property damage and disruptions to economic activity. However, the true extent of these impacts for any given event remains unclear due to the unpredictable nature of weather events, each with unique characteristics, including location and intensity. Consequently, outcomes may vary significantly for different households and businesses depending on the event. Moreover, the physical and mental health impacts resulting from such events have not been fully quantified, lacking specific literature tailored to New York City’s context. For instance, Hurricane Sandy’s economic impacts were estimated at $20 billion, but the full spectrum of consequences remains difficult to accurately capture.
In response to the mounting climate threats, the City has taken steps to enhance its understanding of flood vulnerability through VIA (Vulnerability, Impact, and Adaptation) research. The initiative brings together scientific and qualitative information on social and economic vulnerability, public health, and climate change to inform policy and actions, and to understand the opportunities and tradeoffs of various mitigation and adaptation strategies for the most vulnerable and at-risk communities. This work includes the development of a Flood Vulnerability Index (FVI) tailored to New York City’s unique characteristics, similar to the City’s existing Heat Vulnerability Index (HVI). As a result of this research, New York City will be better equipped to make more informed policy decisions to build flood resilience and protect the city’s social, economic, and environmental well-being.
Extreme Rainfall / Stormwater Flooding: Moderate Flood with Current Sea Levels
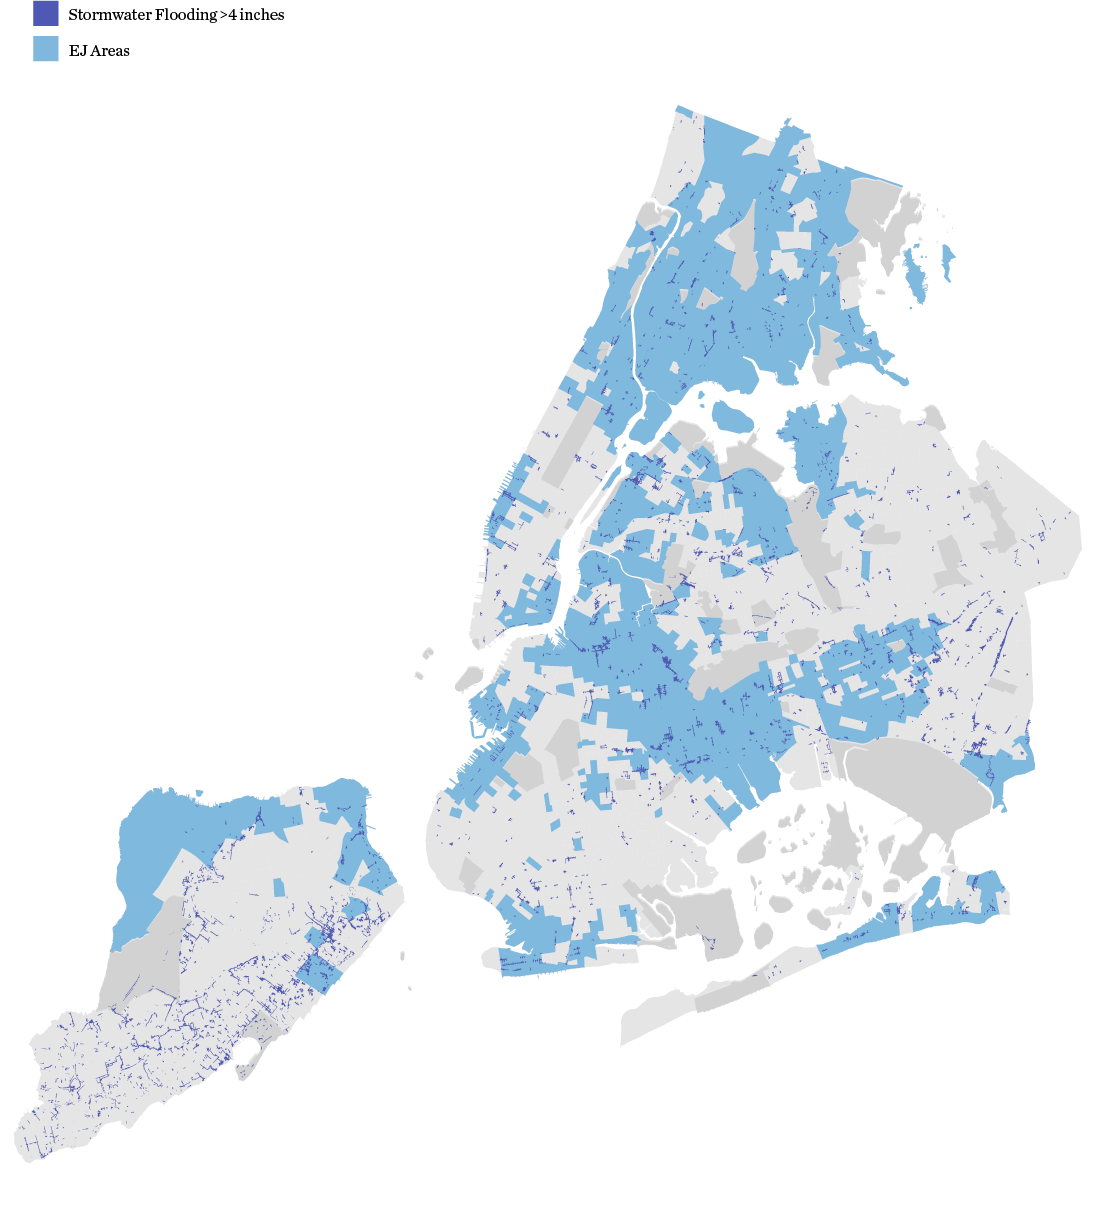
SOURCE: NYC Department of Environmental Protection, NYC Stormwater Flood Map – Moderate Flood with Current Sea Levels, 2022. NYS Department of Environmental Conservation, Disadvantaged Communities Criteria, 2023.
Extreme Rainfall / Stormwater Flooding: Extreme Flood with 2080s Sea Level Rise
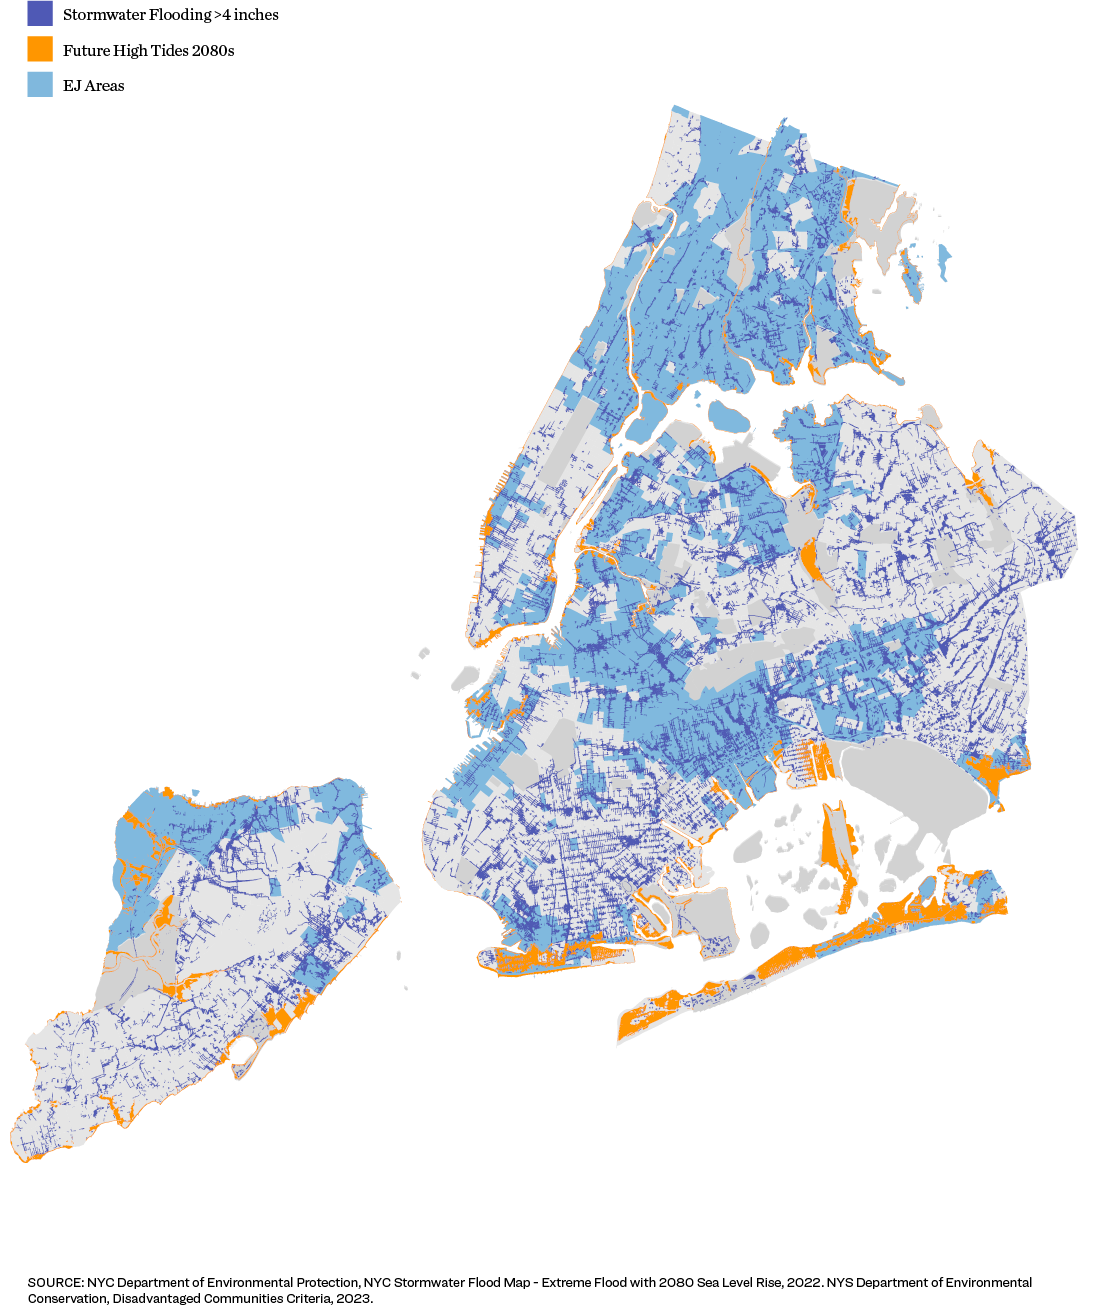
SOURCE: NYC Department of Environmental Protection, NYC Stormwater Flood Map – Extreme Flood with 2080 Sea Level Rise, 2022. NYS Department of Environmental Conservation, Disadvantaged Communities Criteria, 2023.

Grantee winners include Inner City Green Team (left) and Neighborhood Stat.
Program/Policy Spotlight
Nycha Climate Action Grant Program
LEAD AGENCY: New York City Housing Authority (NYCHA)
In 2022, NYCHA and the Public Housing Community Fund launched a Climate Action Grant program for residents, following a series of climate action workshops conducted to solicit resident input into NYCHA’s Sustainability Agenda and Climate Adaptation Plan prior to their release. The workshops also served to elevate awareness about energy and sustainability projects and initiatives and build a community around sustainability-related activism. Climate Action Grants are funded by private contributions including from ConEdison and Kinetic Communities, and are intended to provide support for small, resident-generated sustainability projects as a complement to the larger scale programs designed to address sustainability and resiliency issues at the building and development level. Eligible projects for the grant opportunity include community- building events, educational and recreational programming, urban gardening, recycling activities, and other resiliency or sustainability- related actions.448Resident Climate Action Grants. (n.d.). NYCHA. NYC Government.
In January 2023, NYCHA awarded a total of $27,500 to the first four winners of the program. The winning proposals include two community garden revitalization projects, an energy efficiency workshop with free LED light bulbs provided to attendees, and a “One-Stop-Drop” recycling center for electronics, clothes, and composting.449Fund for Public Housing, NYCHA, and Con Edison Announce the Winners of the Resident Climate Action Grant Program. (2023). Fund for Public Housing. Nonprofit Organization.
NYCHA’s Sustainability Agenda represents NYCHA’s commitment to advancing sustainability at NYCHA’s buildings and neighborhoods. The grants program is one component of its efforts to prepare and support its residents to mitigate and adapt to climate change. The City seeks to use lessons learned from NYCHA’s grant program to explore other opportunities to invest in resilience efforts for vulnerable populations.
Funding and Resource Allocation
Federal, state, and local funding support climate resiliency efforts throughout New York City. The City has actively pursued federal funding opportunities, such as the Federal Emergency Management Agency’s (FEMA) Building Resilient Infrastructure and Communities (BRIC) and Flood Mitigation Assistance (FMA) grant programs, to help communities plan for and protect against climate hazards. However, there are limitations with the Benefit-Cost Analysis (BCA) formulas used to allocate FEMA funds, including a failure to explicitly consider “distributional factors” such as income, race, or geographic location.450The Cost of Cost-Effectiveness: Expanding Equity in Federal Emergency Management Agency Hazard Mitigation Assistance Grants. (2023). Miller, B., Clancy, N., Ligor, D., Kirkwood, G., Metz, D., Koller, S., and Stewart, S.. RAND Corporation. Research Organization.
In the aftermath of climate hazards events like those experienced in New York City during Hurricane Sandy and Hurricane Ida, post- disaster funding is essential to facilitate recovery and reconstruction efforts, as well as climate adaptation. However, this funding is often tied to only those areas directly impacted by the disaster, leaving many other vulnerable communities without the necessary resources to protect against future events. Research into FEMA disaster response funding, as well as mitigation grant programs, suggests the program perpetuates existing inequities by funding more efforts in wealthier, whiter communities.451, 452, 453ENDNOTECOPY
Looking ahead, there is potential for significant support through federal initiatives such as the Infrastructure Investment Jobs Act (IIJA), Inflation Reduction Act (IRA), and the Justice40 Initiative. These initiatives aim to integrate environmental justice considerations into funding allocations, ensuring that resiliency projects benefit all communities, including those disproportionately impacted by climate change and environmental hazards.
In addition to federal funding, New York State also plays a crucial role in supporting climate resiliency efforts. The Clean Water, Clean Air, Green Jobs Bond Act, also known as “The Environmental Bond Act,” will provide $4.2 billion in funding for projects that safeguard drinking water sources, reduce pollution, and protect communities and natural resources from climate change. The bill includes funding provisions for environmental justice communities, allocating at least 35 percent of funding for clean energy and energy efficiency programs to disadvantaged communities significantly impacted by environmental changes.
At the city level, the City has attempted to embed equity and environmental justice considerations. One noteworthy example is the Cloudburst Management program, which constructs grey and green infrastructure projects to manage flooding from extreme rainfall. As part of the Cloudburst Management program neighborhoods are selected through an equity-informed process that considers historic and future stormwater flooding hotspots, existing city projects, environmental justice areas, and social factors that may increase vulnerability to stormwater flooding. The City also launched Climate Strong Communities (CSC) in 2023, which involves the next generation of equitable, multi-hazard, pro-active resiliency and sustainability projects by maximizing unprecedented infrastructure and climate funding opportunities that are focused on the most at-risk and environmental justice neighborhoods in the city. This effort would include a collaborative planning process, bringing together City agencies and community stakeholders to ensure the projects reflect community priorities.
Despite the efforts made in securing climate resiliency funding, challenges remain in tracking and monitoring these investments. Historically, New York City lacked a centralized system to comprehensively record and assess resiliency projects. Through the Climate Budgeting initiative, the City will begin integrating climate considerations into budget decisions and track progress towards climate goals through annual progress reports. Similarly, MOCEJ will be working with OMB to determine a framework for defining and assessing EJ investments. Together, these efforts can increase transparency and accountability around climate and environmental decision-making.
Stakeholder Input
The following collection of quotes from the focus groups and interviews, conducted as part of the qualitative research for this report, speak to the various issues associated with climate change and environmental justice.
Extreme Heat
“There is this tendency to focus on storm surges because that’s sexy, it’s violent, the media loves it. But the thing that concerns us, particularly because of the health profile of our community, is extreme heat.”
“I think the extreme heat where our people live is a real problem, because those areas tend to be densely populated, without enough green spaces, and that has multiple impacts. It puts a lot of community members at risk, not just in terms of their health, but also economically.”
Coastal Storm Surge
“We have the lowest lying floodplains in New York City on the eastern end of the Rockaways, in particular…we have much more exacerbated issues with flooding. When you see which communities are the most vulnerable to flood and see what they look like demographically, it seems those most underrepresented are affected by flooding more than the rest of the peninsula.”
“We have got zero help. My parents are both seniors. The insurance company has denied their claims from flooding because we’re now living in a flood zone and they have been pretty much no help from nowhere.
“[…] And the issue is we, all the agencies need to work together. The problem I’ve discovered within the last year, it seems like you’re going around a circle when they’re dealing with these different agencies. It seems like there’s no communication barrier.”
Extreme Rainfall
“How many more deaths do we need? Nothing meaningful has changed over the last year. If another major storm comes tomorrow, we can wake up the next morning with devastating news. We know these are death traps—if I’ve fallen asleep, I may wake up to water coming over me, and I cannot escape. People who survived said they didn’t expect it, and it had never happened before.”
Next:Engaging the Public on Environmental Justice >>