This section focuses on exposure to hazardous materials across three issues and indicators: hazardous waste generators and storage facilities, contaminated land, and hazardous material incidents. The findings point to opportunities for the City to improve accountability through increased data transparency and explore and develop new ways to collaborate with environmental justice communities.
Hazardous materials are any substances that are ignitable, corrosive, reactive or toxic.282 Toxic materials refer to any substance that poses a threat to human health and the environment. They can cause cancer or other chronic human health effects, significant adverse health effects, and/or significant adverse environmental effects.283 Exposure can occur through inhalation, ingestion, or absorption through the skin during the operation of polluting facilities or because of contact with the harmful pollutants left behind when such facilities are shut down or abandoned.
Hazardous materials have been a significant focus for the environmental justice movement. In the 1980s, environmental justice organizers across the nation mobilized in response to Black and Hispanic or Latino communities being disproportionately exposed to hazardous materials compared to white communities.284 In the 1990s, delegates to the First National People of Color Environmental Leadership Summit identified the production and disposal of hazardous wastes and compounds in these communities as key concerns of environmental injustice.285
In the nineteenth century, New York City’s manufacturing sector grew to become one of the largest clusters of industrial activity in the United States. Raw materials that came through the city’s ports drove the growth of manufacturing along the city’s waterfronts.286Urban Colossus: Why is New York America’s Largest City? (2005). Glaeser, E. Federal Reserve Bank of New York Policy Review. US Government., 287Port History. (2021). New York Shipping Association. Nonprofit Organization. While sugar refining, textile production, and printing were the major industries of the era, a 1919 industrial map of New York City shows large swaths of Brooklyn, Queens, and the South Bronx producing metal products, chemicals, and paint.2881919 Map of New York City’s Manufacturers Shows a Bygone Industrial Landscape. (2014). Onion, R. Slate. News Article.
Many of these industries operated throughout the early-to-mid twentieth century, and NYC remains home to many polluting facilities to this day. Technological improvements and more stringent environmental regulations have reduced some impacts of these industrial facilities, which are required to operate within strict guidelines and regulations, and must regularly report on their management, storage, and emission of hazardous materials.
Attributing the presence of hazardous materials to community health outcomes and environmental burdens is a complex task which would require the measurement and modeling of multiple variables that are not readily available. Therefore, this report cannot make definitive assertions about the impact of hazardous materials on EJ communities, and instead analyzes available data that provides insight into the presence of hazardous materials in communities across New York City. This includes the locations of regulated hazardous waste generators and storage facilities, the locations of known brownfields, and the locations of occurrences of incidents involving hazardous materials like oil spills, gas leaks, and other accidents that may potentially lead to exposure to hazardous or toxic materials.
Data Analysis
Hazardous Waste Generators and Storage Facilities
Hazardous waste generators and storage facilities refer to any businesses that produce, use, or store substances that are considered hazardous. As of 2022, over 12,600 such facilities are systematically tracked and required to file reports with the New York City Department of Environmental Protection (DEP) under the 1988 Community Right-To-Know Law.289Hazardous Materials Management in New York City: 2022 Annual Report. (2022). NYC DEP. NYC Government. In addition, hazardous waste generators, storage facilities, and processors are required to register with the New York State Department of Environmental Conservation (DEC) under the Resource Conservation and Recovery Act (RCRA).290Hazardous Waste Management. (2023). NYS Department of Environmental Conservation. NYS Government. The types of facilities required to register under these laws include manufacturing facilities, warehouses, food
production plants, repair shops, hospitals, science labs, and many more businesses.
Of these facilities, the largest point-source generators of hazardous pollution in the city are those that are required to report their emissions to the EPA under the Toxics Release Inventory (TRI) program.291Hazardous Materials Management in New York City: 2022 Annual Report. (2022). NYC DEP. NYC Government. These TRI facilities “manufacture, process or otherwise use” any of the 770 chemicals covered by the TRI program that are known to cause chronic and/or acute health impacts or adverse environmental effects. These facilities are subject to strict reporting requirements and must keep their emissions within acceptable limits. In 2022, just over half of the city’s 35 TRI facilities were located in EJ neighborhoods, and 58 percent of TRI facilities that reported toxic chemical releases to the US EPA in that year were located in EJ Neighborhoods. The table below lists the top 10 neighborhoods with TRI facilities that reported the greatest quantities of toxic chemical releases to the US EPA in 2022.
Top 10 Neighborhoods with the Most Toxic Chemical Releases Reported by Toxics Release Inventory (TRI) Facilities to the US EPA
| NEIGHBORHOOD (NTA)vi | TOTAL RELEASES IN 2022 (LB)vii | PERCENTAGE OF CENSUS TRACTS CLASSIFIED AS AN EJ AREA |
|---|---|---|
|
Steinway, QN |
88,192 |
44% |
|
New Springville-Bloomfield-Travis, SI |
73,853 |
13% |
|
Stuyvesant Town-Cooper Village, MN |
45,850 |
0% |
|
Brooklyn Navy Yard, BK* |
24,345 |
87% |
|
Queensbridge-Ravenswood-Long Island City, QN* |
20,156 |
100% |
|
Far Rockaway-Bayswater, BK* |
8,699 |
56% |
|
Greenpoint, BK* |
2,666 |
68% |
|
East Williamsburg, BK* |
1,930 |
67% |
|
Mott Haven-Port Morris, BX* |
662 |
99% |
|
East New York (Pennsylvania Ave), BK* |
128 |
100% |
*EJ Neighborhood
SOURCE: US Environmental Protection Agency, Toxics Release Inventory Basic Data Files, 2022
vi Excludes airports
vii Includes on and off-site releases.
Community Case Study
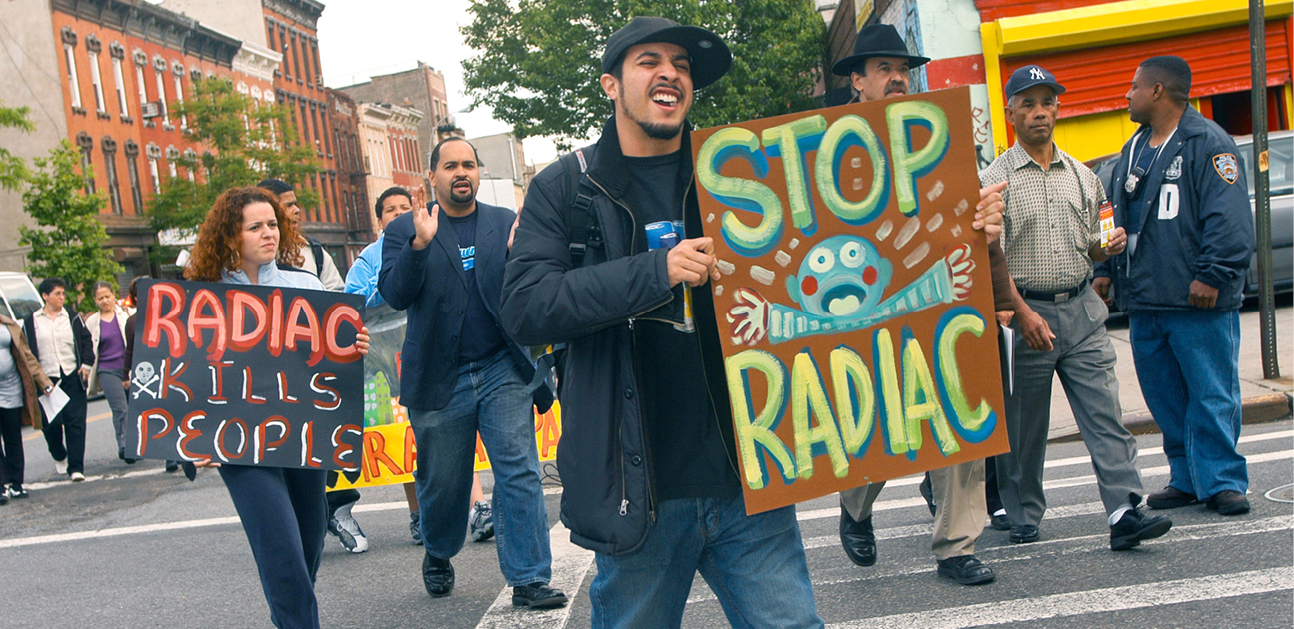
El Puente & Radiac
LOCATION: Williamsburg, Brooklyn
In industrial Williamsburg, Brooklyn, where polluting land uses abut schools, homes, and businesses, residents have long rallied for the cleanup of hazardous waste in their neighborhood. Since the late 1980s, advocates led by the community-based organization El Puente have been organizing against Radiac, a chemical waste facility in the low-income Hispanic or Latino and Hasidic Jewish neighborhood. Built in 1969, the Radiac facility has been a storage and transfer facility for chemical and low-level radioactive waste.292On The Chemical Waterfront. (2014). Sundberg, S. New York Press. News Article.
For decades, advocates led by El Puente have worked to shutter the facility, arguing that Radiac poses a threat to their communities’ health and safety because of the risk of an accident. Early on in its campaign, El Puente organized a youth advocacy group called Toxic Avengers, which went door to door raising awareness about the facility and led community mobilizations against it. In 2005, advocates lobbied the State of New York not to renew a permit Radiac needed to function as a storage facility. Radiac withdrew its application for the permit and transitioned from a storage facility to a medical and radioactive waste transfer station only. While many in the community viewed this as an important step forward, El Puente continued working to shutter the facility altogether, citing concerns regarding the potential risk of an accidental release of hazardous chemicals or the ignition of radioactive materials in the event of a fire or other emergency. In 2007, El Puente and the Toxic Avengers supported a bill that would have prohibited medical waste handling facilities within 1,500 feet of schools, prohibiting Radiac’s operations.293Assembly Bill A07995A. (2007). NYS Assembly. NYS Government.The bill passed the legislature but was vetoed in 2010 by then-Governor David Paterson.294ENDNOTECOPYEl Puente continues to fight for the closure of the Radiac facility, a fight that has galvanized community action and solidarity for decades through youth-led efforts like the Toxic Avengers.
Most of the neighborhoods with the greatest quantity of toxic chemical releases reported by TRI facilities to the US EPA are EJ Neighborhoods. These neighborhoods are largely located along the city’s industrial waterfronts or in other heavily industrialized areas (27 of the city’s 35 TRI facilities are located within a Significant Maritime Industrial Area or Industrial Business Zone).
The concentration of TRI facilities in EJ Neighborhoods raises concerns from residents due to the uncertainty surrounding potential exposure to hazardous materials and the associated long- term health effects. DEP data on TRI releases in each community district show that the greatest single material emitted citywide is ammonia. In Queens CD-1, which includes Steinway and Queensbridge-Ravenswood-Long Island City, over 63,000 pounds of ammonia was released in 2021.295Hazardous Materials Management in New York City: 2022 Annual Report. (2022). NYC DEP. NYC Government. Other hazardous material emissions of note include hundreds of pounds of benzene, xylene, n-hexane, toluene, 1,2,4 trimethylbenzene, and benzo(g,h,i) perylene emitted in 2021 in both Queens CD-1 and Brooklyn CD-1, which includes Greenpoint and East Williamsburg. Trace amounts of lead and lead compounds were emitted into the air in Brooklyn CD-5, which includes East New York (Pennsylvania Avenue), and small amounts of other compounds such as polycyclic aromatic compounds, benzo(ghi) perylene, naphthalene, and ethylbenzene were emitted in other community districts.296ENDNOTECOPY
The hazard summary sheets for these various compounds show that some of them, such as benzene and xylene, pose reproductive and/or cancer hazards resulting from chronic exposure, however, in many cases the chronic health impacts of exposure are not fully understood.297Hazardous Substance Fact Sheet: Ammonia. (2016). NJ Health. NJ Government., 298Hazardous Substance Fact Sheet: Xylenes. (2016). NJ Health. NJ Government., 299Hazardous Substance Fact Sheet: Benzene. (2016). NJ Health. NJ Government., 300Hazardous Substance Fact Sheet: n-Hexane. (2016). NJ Health. NJ Government., 301Hazardous Substance Fact Sheet: Pseudocumene. (2016). NJ Health. NJ Government., 302Hazardous Substance Fact Sheet: Toluene. (2016). NJ Health. NJ Government. Importantly, residents in neighborhoods with high concentrations of industrial facilities perceive a connection between the chemical releases in their neighborhoods and the health issues they face, but it is nearly impossible to quantify the impact such releases have on communities.303Public Housing Tenants Struggle Against the “Slow Violence” of Industrial Pollution. (2023). Mahoney, A. The City. News Article. As such, the term “slow violence” was coined to describe these kinds of environmental burdens that occur too slowly for causality and blame to be clearly ascribed.304, 305ENDNOTECOPY
There are many other types of businesses that store, use, and handle hazardous substances and file disclosures under the Community-Right-to- Know Law. Among these are over 5,700 cellular and wireless telecommunications facilities that use lead-acid batteries for backup power systems. These batteries pose little risk of community exposure to hazardous materials through direct contact according to the DEP Hazardous Materials Management Annual Report.306Hazardous Materials Management in New York City: 2022 Annual Report. (2022). NYC DEP. NYC Government. There are also 2,070 automotive repair shops, 643 automotive body shops, and 452 dry cleaners that New Yorkers frequent regularly for their services. Many of these businesses hire locally and are important to local economies in EJ Areas. However, these facilities use hazardous chemicals such as perchloroethylene (PERC), exposure to which through the air, water, or direct contact with skin can cause adverse health effects, such as damage to the nervous system, eyes, liver, and kidneys.307Perchloroethylene (PERC). (2022) NYC DOHMH. NYC Government.
New York State restricts the use of PERC in facilities that have at least one residence as of December 21, 2020. Furthermore, DEP rules require dry cleaners that use chemicals other than PERC to post a notice identifying the primary non-PERC chemical in use and information from the Material Data Sheets. These DEP regulations are important as the EPA only recently updated its risk evaluation for PERC to consider additional pathways to exposure and concluded that it presents an unreasonable risk to workers, occupational non-users, consumers and bystanders.308, 309, 310
This report analyzed data provided by DEP to understand the distribution of these chemically intensive small businesses and found that automotive businesses are distributed in a similar pattern as TRI facilities. The community districts with the greatest concentration of these facilities are comprised almost entirely of EJ Neighborhoods, many of which are in community districts that contain heavy industrial areas: in Jamaica and along the western waterfront in Queens, in East New York, East-Flatbush-Farragut, and Greenpoint and East Williamsburg near Newtown Creek in Brooklyn, along the North Shore of Staten Island, and in Eastchester in the North Bronx.
Chemically Intensive Small Businesses
Chemically intensive small businesses include general automotive repair, automotive body, paint, and interior repair and maintenance, and dry cleaning services facilities.
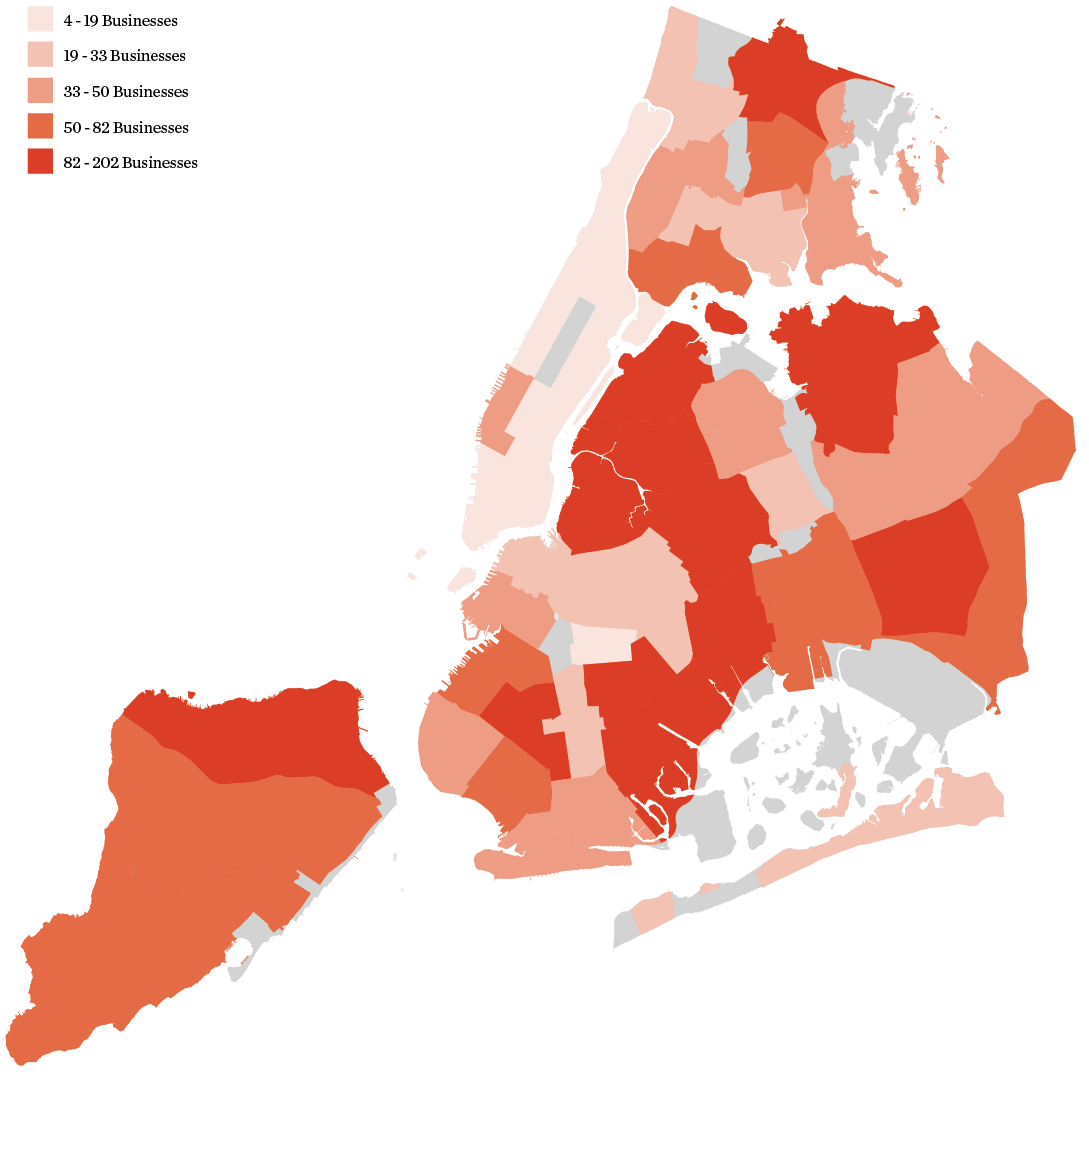
SOURCE: NYC Department of Environmental Protection, Community Right-to-Know Program, 2022.
Community Case Study
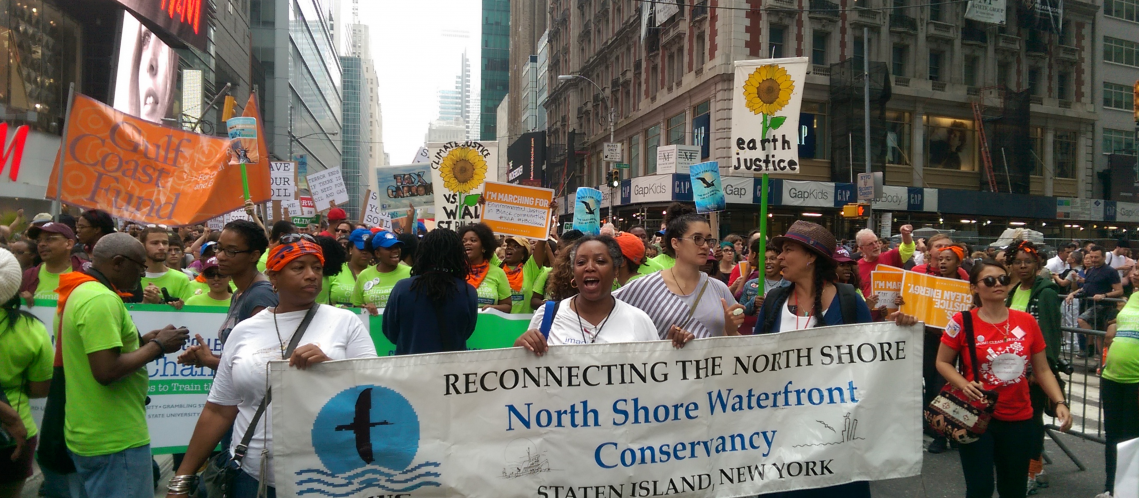
North Shore Waterfront Conservancy of Staten Island
LOCATION: North Shore, Staten Island
Spanning Staten Island’s North Shore, from St. George to Arlington, is one of New York City’s largest industrial waterfronts and a Significant Maritime Industrial Area (SMIA). It is home to several communities of color and low-income communities who have been disproportionately exposed to the impacts of its industries. Staten Island’s Community District 1 (CD 1), which includes this industrial area, is physically separated from the rest of borough by the Staten Island Expressway to its south. It is demographically distinct from the rest of the borough. Staten Island is majority white overall, but CD 1 is majority people of color, with substantial Hispanic or Latino and Black populations.311Community District Profiles: Staten Island Community District 1. (n.d.). NYC Planning. NYC Government.
The North Shore Waterfront Conservancy of Staten Island (NSWC) was a community-based organization founded in 2000 to promote safe and sustainable access to the waterfront.312North Shore Waterfront Conservancy of Staten Island: Beryl Thurman. (2020). Women Build Community. Community Organization.NSWC advocated for the remediation of a string of industrial sites along Staten Island’s North Shore, including former factories to publicly- owned facilities such as the Department of Sanitation’s Jersey Street Garage, now scheduled to be relocated in 2024. These facilities could pose the risk of exposure to hazardous waste such as asbestos, PCBs, and heavy metals in the event of an accidental release.313Staten Island’s Gold Coast, Second Edition. (2012). Thurman, B. Community Organization.In addition, industrial sites can generate heavy truck traffic that introduces other hazards such as air pollution, contributing to the concentration of environmental hazards in low-income communities of color. Due to NSWC’s advocacy efforts, the Environmental Protection Agency (US EPA) designated the North Shore an ”Environmental Justice Showcase Community” in 2009 and allocated $100,000 in funding to support projects that address the persistent environmental problems that impact waterfront neighborhoods.314EPA names North Shore ”a showcase community.” (2010). Sherry, V. Staten Island Live. News Article. NYC Parks has since made progress towards rehabilitating the four City-owned parks identified through NSWC’s Gold Coast report: Van Pelt/Van Name Shoreline, Blissenbach Marina, Mariner’s Marsh, and Arlington Marsh.315North Shore of Staten Island Habitat Restoration and Green Infrastructure Plan. (2018). NYC Parks. NYC Government.NSWC lives on through a new organization, Creating Livable Communities, which continues to advocate for the redress of environmental disparities for waterfront communities on and off Staten Island.
There are several limitations to this report’s accounting of New Yorkers’ potential exposure to hazardous or toxic materials. The preceding analysis considers the locations of currently operating facilities that utilize hazardous materials and by extension may expose residents to them. However, all sites were considered as equal potential sources of exposure, whereas in reality, the type and amount of hazardous substances that are stored and emitted varies across facilities. Multiple additional variables would need to be measured or modeled to better understand the health and environmental burdens that these sites place on their surrounding communities. Data on workers’ and residents’ locations would need to be analyzed to determine any relationship between exposure to hazardous materials and adverse health outcomes, in addition to the complex task of attributing chemical exposure to health outcomes among many other individual health-related criteria.316Proximity to Environmental Hazards: Environmental Justice and Adverse Health Outcomes. (2010). Maantay, J., Chakraborty, J., and Brender, J. US EPA. US Government.
Furthermore, to provide a more comprehensive understanding of the presence of hazardous materials across the city, additional datasets, such as information about high-hazard buildings (where potentially explosive or highly combustible products or materials are stored, manufactured, and processed) could be made publicly available. Other relevant data, such as the historical locations of industrial facilities, dry cleaners, gas stations, and auto body shops have not been compiled. These present opportunities for the City to explore future data collection and mapping efforts to build community awareness of local hazards. Note that some datasets, such as fuel terminal facility locations and fuel tank barge data, are not publicly available for security reasons.
Contaminated Land
Contaminated land is any area that has been polluted by its past industrial use or by the disposal of wastes.317Encyclopedia of Geology (Second Edition). (2021). Doyle, P. Academic Press. Book. Contaminated lands can pose a variety of health and environmental hazards, such as exposing humans, plants, and animals to toxic and hazardous materials. Some contaminated sites pose little risk and others pose greater risk to human health and the environment.318Contaminated Land. (2023). US EPA. US Government.
Relatedly, brownfields are properties, the expansion, redevelopment, or reuse of which may be complicated by the presence or potential presence of a hazardous substance, pollutant, or contaminant.319Contaminated Land. (2023). US EPA. US Government. There are thousands of vacant commercial and industrial sites in the City and thousands more properties designated by the City as subject to mandatory environmental study and management. In New York City and across the country, there is no complete list of potentially contaminated sites and no widespread effort to investigate legacy industrial areas across the city for existing contamination, as these investigations are typically undertaken on a site-specific basis. This makes it difficult to assess the true distribution of contaminated land in EJ Areas and its impact on residents.
However, various local, state, and federal cleanup programs have been developed to identify potentially contaminated sites and remediate them.320PlaNYC. (2011). The City of New York. NYC Government. The cleanups carried out under these programs involve removing pollution or contaminants from water and soil to the benefit of the environment, human health, and the economy.
There are crucial distinctions between these programs; Federal and State Superfund cleanup sites are established based on environmental and public health concerns due to the severity of contamination, whereas local and state brownfield cleanups are driven by economic development plans and the real estate market. As a result, the latter tend to be concentrated in areas that have been rezoned and are undergoing large- scale redevelopment. This analysis is limited in that it cannot draw a direct comparison between the distribution of NYC’s brownfield cleanup sites and contaminated land, given the lack of comprehensive data for the latter.
Environmental Remediation Sites
Sites depicted here include all active environmental remediation sites under the supervision of NYC Office of Environmental Remediation (OER) or NYS Department of Environmental Conservation (DEC) and sites on the National Priorities Lists per U.S. Environmental Protection Agency (EPA). For NYC OER sites, this includes all sites in the E-Designation program where cleanup is required as well as sites in the NYC Voluntary Cleanup Program. US EPA Superfund (NPL) sites are outlined in black (these are not included in the site counts).
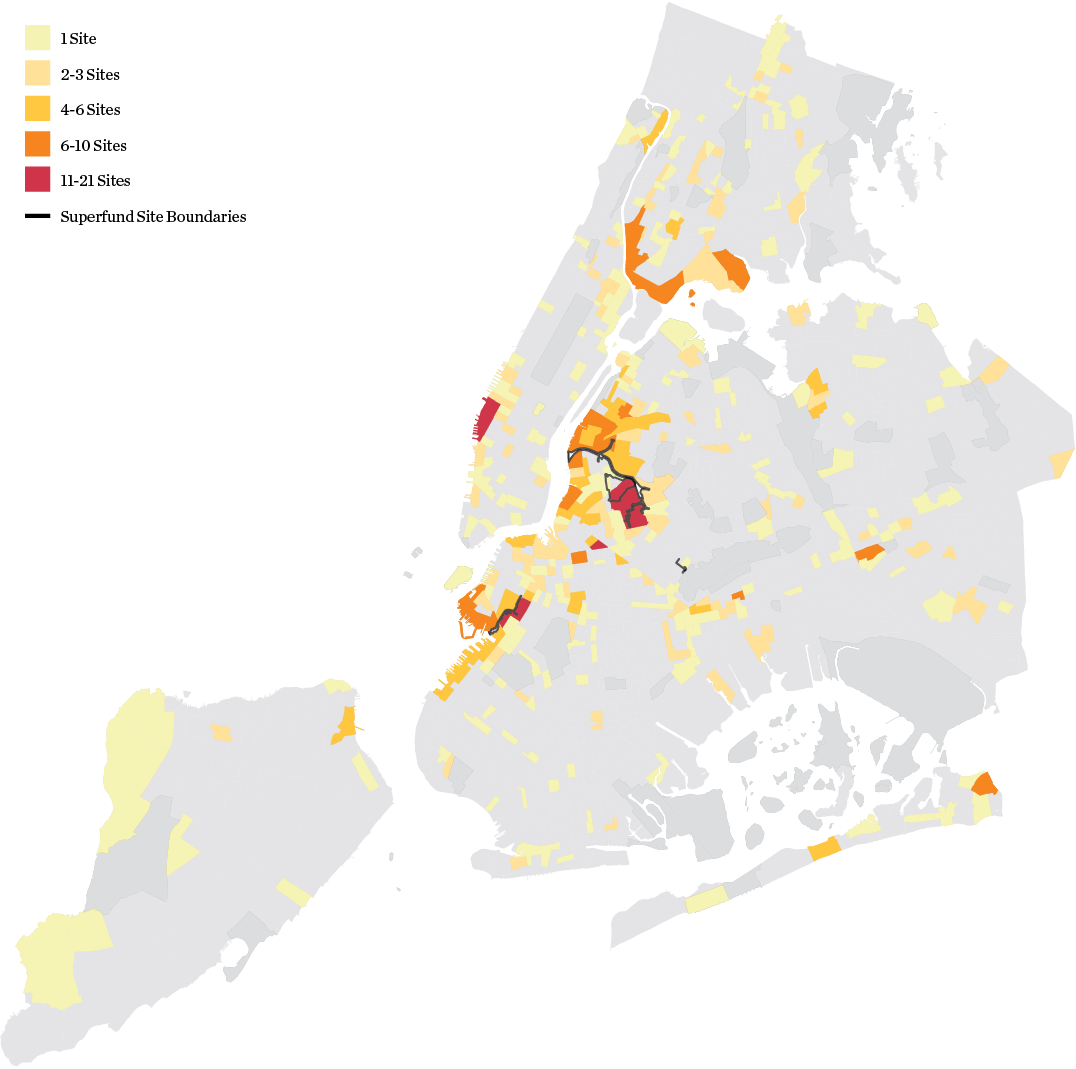
SOURCES: NYC Office of Environmental Remediation, OER Cleanup Sites, 2022. NYS Department of Environmental Conservation, Remediation Sites, 2022. US Environmental Protection Agency, Superfund Site Boundaries.
Program/Policy Spotlight
Environmental Remediation
LEAD AGENCY: Mayor’s Office of Environmental Remediation (OER)
The Mayor’s Office of Environmental Remediation (OER), established in 2009, manages two land cleanup programs, the E-Designation Program and the NYC Voluntary Clean-up Program (VCP). Through the E-Designation Program, OER oversees the environmental investigation, approval of cleanup plans, and the remediation of rezoned property whose redevelopment may involve exposures to hazardous materials. Associated requirements of an E-Designation, but not related to hazardous materials, are concerned with air quality and noise. Projects on tax lots that are E-designated cannot receive building permits until OER approves their plans to address the environmental issues present and cannot receive a certificate of occupancy until OER determines that the remedial work has been completed. Sites with an E-designation for hazardous materials can satisfy their remedial obligations by and implementing an approved cleanup plan.
The VCP is an incentive-based cleanup program that allows landowners and developers to choose oversight and through successful completion of the program gain access to grants and liability protection for their remediation projects. Projects in the VCP are eligible for City grants for environmental investigation and clean-up of$25,000 to $50,000.321Voluntary Cleanup Program. (2022). NYC OER. NYC Government.Additionally, projects in the VCP can receive and dispose of clean soil at the City’s soil stockpile at no cost.
An analysis of VCP remediation projects across the city showed that about 92 percent of projects are on E-designated tax lots identified through rezoning applications.322NYC OpenData, OER Cleanup Sites (2022). NYC OER. NYC Government.Approximately 21,000 affordable housing units have been constructed on land remediated under OER oversight.323Community Planning with OER. (n.d.). NYC OER. NYC Government.Other beneficial uses developed on VCP sites include schools, healthcare facilities, childcare services, and shelters.
OER also offers community-based organizations (CBOs) grants of up to $25,000 to conduct neighborhood planning studies and advance the redevelopment of vacant or underutilized land. In addition, OER provides real estate advisory services and pro bono environmental assistance by connecting community organizations with relevant professionals. This funding and technical support is a best practice example of CBO capacity-building that the City seeks to build on in the future.
Organizations that have received Community Brownfield Planning Grants work in the North Shore of Staten Island; Sunset Park, Greenpoint, and East Williamsburg in Brooklyn; Bradhurst in Manhattan; Jamaica in Queens; and Port Morris in the Bronx, among other neighborhoods. Notably, 90 percent of the benefiting census tracts are EJ Areas.324BOA and Community Brownfield Planning Areas—Designated BOAs. (2023). NYC OER. NYC Government.OER also supports CBO-run brownfield job training programs by writing letters in support of funding, serving on steering committees, and connecting potential employers with graduates of the programs. Furthermore, OER runs a clean soil delivery program that provides free clean soil and topsoil to school and community gardens in Brooklyn and Queens.
In view of these data limitations, this report analyzes the distribution of local, state, and federal cleanup sites since they provide a partial indication of where contaminated land is known to exist. Note, however, that most cleanups are undertaken by private parties without government oversight, and these are not reflected in City, state, or federal databases.
Across the five boroughs, there are hundreds of New York State and New York City cleanup sites, and four federal Superfund sites that are on the National Priorities List: the Gowanus Canal in Brooklyn, the four-mile-long Newtown Creek in Queens and Brooklyn, the former Wolff-Alport Chemical Company in Queens, and the Meeker Avenue Plume in Brooklyn.325New York City now has four Superfund sites. Where are they? (2022). Feldman, A. NY1. News Article. There are many other remediation sites managed by federal agencies not included in this Report’s analysis including Superfund Alternative Approach sites, Formerly Utilized Sites Remedial Action Program (FUSRAP) sites, Cleanups at Federal Facilities sites, and more. However, the City is not aware of comprehensive list of all contaminated land managed by federal agencies.
As heavy industries departed New York City throughout the second half of the 20th century, they left behind thousands of acres of environmentally contaminated properties. These brownfields require remediation before they can be redeveloped for more sensitive land uses (such as office buildings, stores, or schools). Historically, developers, property owners, and community organizations lacked legal mechanisms for volunteering to remediate sites. Furthermore, lenders were wary of providing financial support to pursue remediation, and the companies responsible for polluting the sites often no longer existed or could not afford to pay for site cleanup.326PlaNYC. (2011). The City of New York. Many of these areas have since undergone large, City-led rezonings and state and local brownfield cleanup programs are providing incentives to private entities to facilitate the cleanup and repurposing of these properties.327, 328, 329ENDNOTECOPY
For these reasons, many neighborhoods with greater concentrations of cleanup sites lie along the city’s waterfront, particularly in communities surrounding heavy industrial areas. Many of these same neighborhoods are EJ Areas. This analysis (p.101) shows concentrations of local, state, and federal cleanup sites in areas in Manhattan such as East Harlem, Inwood, and Chelsea; in Brooklyn, such as the East River waterfront, and areas surrounding Newtown Creek and the Gowanus Canal; in Queens in Jamaica and Long Island City; and in the South Bronx. These areas were once home to heavily polluting industries and experienced decades of disinvestment and neglect, in part due to complications resulting from legacy contamination.
Hazardous Material Incidents
Accidental releases are another way that workers, communities, and the environment can be exposed to hazardous materials. The DEP Bureau of Police and Security’s Division of Emergency Response and Technical Assessment (DERTA) responded to 2,640 incidents in 2022. Over a third of these responses resulted from reports of chemical odors (35 percent). The next most common responses were due to petroleum spills (22 percent) and chemical spills (17 percent), followed by responses to abandoned chemicals and storage (13 percent) and methane gas leaks (8 percent).330Hazardous Materials Management in New York City 2022 Annual Report. (2022). NYC DEP. NYC Government.
Location data is not available for all hazardous material incidents responded to by DERTA, but an analysis of complaint data provided by DEP showed that many of the neighborhoods with higher concentrations of hazardous material sites also had higher levels of hazardous material complaints in 2022. This is particularly true along the industrial waterfront in Queens and along the North Shore of Staten Island.
DERTA Hazardous Materials Responses by Incident Type
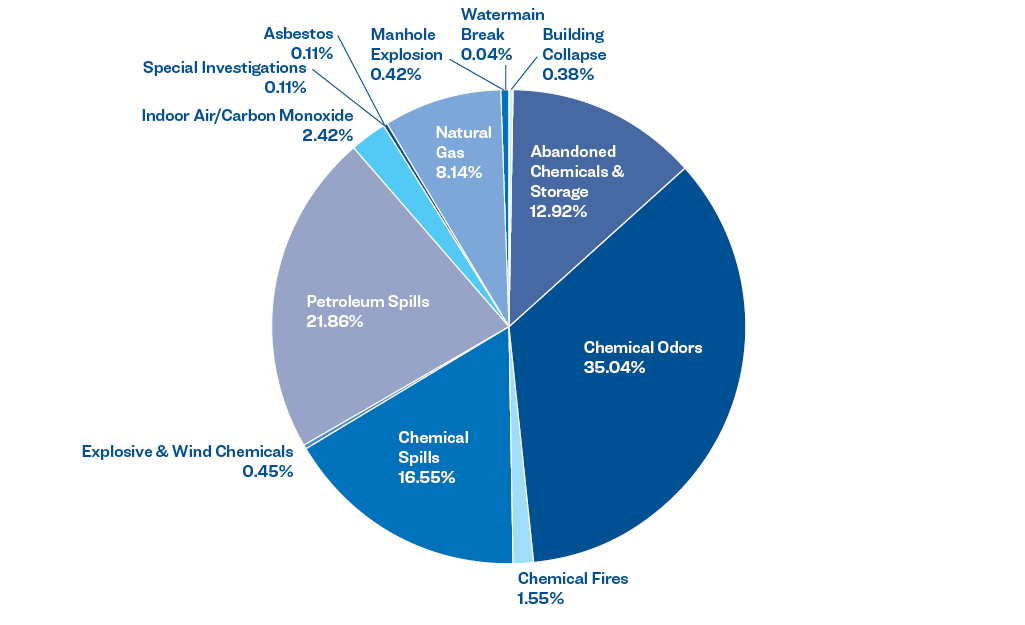
SOURCE: NYC Department of Environmental Protection, Hazardous Materials Management in New York City 2022 Annual Report, 2022.
Top 10 Neighborhoods with the Most Hazardous Material Complaints
| NEIGHBORHOOD (COMMUNITY DISTRICT) | TOTAL HAZARDOUS MATERIAL COMPLAINTS (2022) | PERCENTAGE OF CENSUS TRACTS CLASSIFIED AS AN EJ AREA |
|---|---|---|
|
Flushing-Murray Hill-Whitestone (QN CD-1) |
49 |
30% |
|
Fresh Meadows-Hillcrest-Briarwood (QN CD-8) |
35 |
8% |
|
Astoria-Queensbridge (QN CD-1)* |
26 |
58% |
|
North Shore (SI CD-1)* |
26 |
68% |
|
Mid-Island (SI CD-2) |
22 |
12% |
|
Financial District-Tribeca (MN CD-1) |
20 |
4% |
|
East New York-Cypress Hills (BK CD-5)* |
20 |
100% |
|
Ridgewood-Maspeth-Middle Village (QN CD-5) |
18 |
17% |
|
Wakefield-Williamsbridge-Eastchester (BX CD-12)* |
18 |
73% |
|
Williamsburg-Greenpoint (BK CD-1)* |
17 |
76% |
*EJ Neighborhood
SOURCE: NYC Department of Environmental Protection, Community Right-to-Know Program, 2022.
Note that half of the community districts where the most hazardous material complaints were recorded in 2022 are not EJ Neighborhoods, although this could be due to underreporting or other factors. Research indicates that low-income communities and communities of color may be underrepresented in some complaint data; this could be due to many factors, including that higher income levels are correlated with higher levels of civic engagement.331NYC 311: A Tract-Level Analysis of Citizen-Government Contacting in New York City. (2015). Minkoff, S. Urban Affairs Review. Academic Research. This presents an opportunity for the City to explore new outreach methods and partnerships to engage underrepresented communities.
It may be possible to utilize proxies to estimate where hazardous material incidents are more likely to occur. These proxies could include the location of underground storage tanks (which are usually associated with gas stations), major oil storage facilities, petroleum bulk storage facilities, and chemical bulk storage facilities. However, analyzing these indicators would entail the same limitations discussed in the section on Hazardous Waste Generators and Storage Facilities (p. 95). All facilities are subject to regulations intended to prevent accidental releases, and data regarding the risks or likelihood of an accidental release occurring at any site is not available.
While some datasets on hazardous material incidents do exist, such as the New York State Department of Environmental Conservation’s Spill Incidents Database, this does not account for all types of hazardous material incidents that might occur.332Spill Incidents Database. (2023). NYS Department of Environmental Conservation. State Government. Furthermore, even when data regarding the location of hazardous material incidents is available, it is difficult to attribute such incidents to the levels of exposure to residents, workers, or the environment, and adverse health or environmental impacts that might result from such exposure.
Stakeholder Input
The following quotes from the focus groups and interviews, conducted as part of the qualitative research for this report, speak to the myriad issues associated with hazardous materials.
Hazardous Waste Generators and Storage Facilities
“I live…by a lot of factories. The new Gateway Houses were built on toxic waste, literally toxic waste. There’s so many factories around that area in Starrett City. When you go over there, sometimes it smells like sewer…and it smells so bad. I live in NYCHA and statistics show that people who live in NYCHA have problems with mold and it builds to asthma. I was born with asthma.”
Contaminated Land
“There are 24 contaminated sites along the Staten Island waterfront, with uranium, arsenic, and other chemicals left behind from companies. They just left the chemicals behind and none of it has been mitigated.”
Next:Access to Safe and Healthy Housing >>