Spatial Analysis Methodology
Overarching Analyses
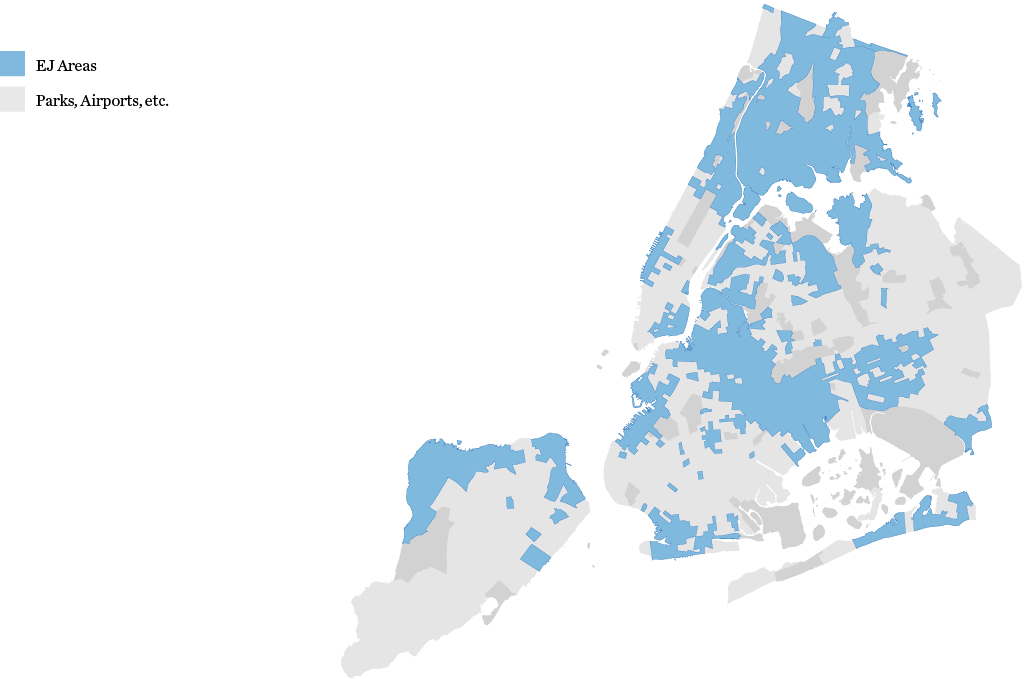
Percent of Nta Population Living in an EJ Area
Data sources: NYS Department of Environmental Conservation, Disadvantaged Communities Criteria, 2023.
Methodology notes: To estimate the percent of the NTA population living within an EJ area the total NTA population was calculated and divided by the total population living in census tracts designated as disadvantaged communities by NYS Department of Environmental Conservation.
Cross Walk of 2020 Acs to 2010 Census Tract Geographies
Data sources: B03002 & C17002, ACS 2021 5 Year Estimates; IPUMS NHGIS, University of Minnesota, www.nhgis.org.
Methodology notes: NYS Department of Environmental Conservation Disadvantaged communities Criteria uses 2010 census tract geographies. To use the latest American Community Survey (ACS) estimates for population and demographics within these older geographies, a geographic crosswalk was used.
National Historic GIS (NHGIS) 2020 Census Blocks to 2010 Census Tracts geographic crosswalk files were used to estimate 2021 ACS 5 Year estimates within 2010 Census Tract geographies. These crosswalks provide interpolated population-based weights to estimate the populations within non overlapping geographies between years. For the greatest accuracy of these adjustments census block estimates for 2021 ACS data were tabulated within 2010 census tracts.
Access to Resources
Population weighted average density of parks per NTA (accessible acreage per
1000 residents)
Source: NYC Department of Parks and Recreation (NYC Parks), Parks Properties, 2023. American Community Survey, 2017-2021 5 Year Estimates. NYS Department of Environmental Conservation, Disadvantaged Communities Criteria, 2023. NYC Department of City Planning (DCP), 2010 Neighborhood Tabulation Areas, 2010.
Methodology notes: The population weighted average number of accessible park acres per 1000 residents were calculated at the census tract level by summing all the acreage for all parks within 1/8 of a mile of the boundary of each census tract. This value was then aggregated to the NTA level (using a population weighted average). This approach takes into account parks that are accessible to a neighborhood even if they are technically outside of its borders (eg. Central Park for the Upper East Side). To estimate accessible park acreage per 1000 residents at the NTA level the population weighted average of accessible acres for each census tract within the NTA was taken.
Tree Canopy Coverage
Source: University of Vermont Spatial Analysis Laboratory New York City Department of Information Technology and Telecommunications (NYC DoITT), Applied Geographics (AppGeo), Quantum Spatial, Land Cover Raster Data (2017) – 6in Resolution.
Methodology notes: Tree canopy coverage per NTA was calculated by determining the percent of the NTAs total area occupied by areas categorized as ‘tree canopy’ in the latest high resolution public remote sensing scan of NYC (LiDAR).
Historically Redlined Neighborhoods (d – Hazardous) and EJ Areas
Source: NYS Department of Environmental Conservation, Disadvantaged Communities (DAC) Criteria, 2023. Robert K. Nelson, LaDale Winling, Richard Marciano, Nathan Connolly, et al., “Mapping Inequality,” American Panorama, ed. Robert K. Nelson and Edward L. Ayers.
Methodology notes: Areas that were historically redlined were mapped based on digitized historical Home Owner’s Load corporation maps, ‘D’ or ‘hazardous’ ratings areas were considered for inclusion. Redlined areas were intersected with census tracts to estimate demographics for residents within these areas. For census tracts that did not fall entirely within the historically red lined area populations and demographics were estimated based on the proportion of the census tract area within the redlined zone.
Alcohol and Tobacco Vendors by Nta
Source: New York State Liquor Authority, Liquor Authority Current List of Active Licenses, 12/01/2022 snapshot, and New York State Department of Health, Active Tobacco Retailer Map, 12/01/2022 snapshot.
Methodology notes: Records for tobacco and liquor licenses were geocoded based on their recorded address within state license records. Records were then aggregated to the census tract and NTA level based on their location.
Transit Access
Source: MTA Subway Stations, 2022, and Newman Library of Baruch College GIS Lab, NYC Bus Stops 2020.
Methodology notes: To estimate the population with limited access to subway transit half mile buffers were calculated around each MTA subway station. These zones were intersected with census tracts and populations and demographics were estimated based on the proportion of the census tract area falling outside of these transit access zones. The same process was used for access to bus stops, with a quarter mile buffer distance used.
Sbs Network Coverage
Source: MTA, NYC Bus Stops September 2023, 2023.
Methodology notes: Bus stop data was gathered using the methodology original used by Newman Library of Baruch College GIS Lab and August 2023 bus data from the Data Feeds from the Metropolitan Transportation Authority (MTA). To estimate the population with limited access to SBS stops quarter mile buffers were calculated around each MTA SBS stop. These zones were intersected with census tracts and populations and demographics were estimated based on the proportion of the census tract area falling outside of these transit access zones.
Bike Network Coverage
Source: NYC DCP, LION Single Line Street Base Map, Release 22C, 2022.
Methodology notes: Bike network coverage was calculated as the total distance of bike lanes within each NTA divided by the total roadway distance (excluding highways).
Source: Department of Transportation (DOT), New York City Bike Routes, 2022.
Methodology notes: Protected bike network coverage was calculated as the total distance of protected bike lanes within each NTA divided by the total roadway distance (excluding highways).
Exposure to Polluted Air
Air Pollution Levels by Nta (ozone, Pm2.5, Nitric Oxide, Black Carbon)
Source: NYC DOHMH, New York City Community Air Survey (NYCCAS) Air Pollution Raster, Black Carbon, 2022.
Methodology notes: Uses the latest available year as input (Dec 2019-Dec 2020) for annual average predicted levels of PM2.5, ozone, nitric oxide and black carbon. In order to summarize at the census tract level, raw raster data source was converted to points. In cases where multiple points intersect a census tract, an average of the values was taken; in cases where no points intersect a tract, the values of the nearest point was assigned to the tract. To evaluate NTA-level values for pollution population-weighted averages were taken for census tracts within each NTA.
Areas Within 1 Mile of Power Plants and Facilities with Title V Permits
Data Sources: Energy Information Administration, Form EIA-860, 2021. New York State, Department of Environmental Conservation, Title V Emissions Inventory, 2020 facilities.
Methodology notes: This analysis highlights all areas within 1 mile of all facilities with Title V permits (2020) and power plants with greater than 1 MW operating capacity (in operation in 2021). Buffers of 1 mile were created and intersected with census tracts to estimate demographics for residents within these areas. For census tracts that did not fall entirely within the 1mile area surrounding polluting facilities population was estimated based on the proportion of the census tract area within the buffer.
Neighborhoods with the Greatest Vehicle Traffic Density
Data sources: NYS DOT, AADT Annual Volume of Vehicle Travel, 2019.
Methodology notes: The population weighted average of AADT for all road segments intersecting each NTA was taken to obtain neighborhood level estimates for the level of vehicle traffic density.
Neighborhoods with the Greatest Volume of Indoor Environmental Air Complaints
Data sources: New York City Office of Technology and Innovation, 311 Service Requests “Indoor Air Quality” complaints for 2022.
Methodology notes: The total number of 311 requests from 2022 of the type “Indoor Air Quality” were geocoded based on latitude and longitude and summed by NTA. Values are expressed in complaints per 1000 residents based on ACS population estimates for each NTA.
Exposure to Hazardous Materials
Toxic Release Inventory Facilities
Source: US EPA, TRI Basic Data Files, 2022.
Method notes: The total number of Toxic Release Inventory facilities and quantity of total releases were calculated at the NTA level.
Automotive Body, Paint and Interior Repair and Maintenance, and Dry Cleaning Services Facilities
Source: NYC Department of Environmental Protection, “Right-to-Know (RTK) Program”, 2022
Method notes: The total number of facilities categorized as automotive repair, automotive body, paint and interior repair and maintenance, and dry cleaning services were calculated at the community district level.
Cleanup Sites
Source: NYC OER, OER Cleanup Sites, 2022. New York State Department of Environmental Conservation, Remediation Sites, 2022. Environmental Protection Agency, Superfund Site Boundaries.
Methodology notes: To obtain a count of clean up sites per census tract all NYS Remediation sites were included and the counts of NYC OER sites, includes all sites in the E-Designation program where cleanup is required. This includes Voluntary Cleanup Program sites if the site also is subject to the E-Designation program.
Solid Waste Management – Average Daily Throughput
Source: DSNY, Annual Report on the Implementation of New York City’s Waste Equity Law, 2022.
Methodology notes: This analysis sums the average daily throughput of municipal solid waste (MSW) and construction and demolition debris (C&D) for material transfer stations subject to LL152 and the MSW transfer stations operated by DSNY. It does not include fill material transfer stations permitted by DSNY and other transfer stations that are not covered by LL152.
Access to Safe and Healthy Housing
Utility Access and Affordability
Source: American Community Survey, 2017-2021 5 Year Estimates. Mayor’s Office of Economic Opportunity.
Methodology notes: Top 25 percent of PUMAs in terms of the percent of households who are utility burdened were calculated based on summarized microdata analyzed by the Mayor’s Office of Economic Opportunity.
Health-related Design and Maintenance Issues
Source: NYC HPD, New York City Housing and Vacancy Survey, 2017.
Methodology notes: This map shows the percent of renter households who report three or more maintenance deficiencies by subboro area with DAC areas overlaid. Maintenance deficiencies include: 1) additional heating required in winter; 2) heating breakdown; 3) cracks or holes in interior walls, ceilings, or floors; 4) presence of rodents; 5) presence of broken plaster or peeling paint; 6) toilet breakdown; 7) water leakage into unit.
Lead Paint Violations
Source: NYC HPD, Code Violations, 2023.
Methodology notes: The number of lead paint-related housing maintenance code violations were summed across NTAs to calculate both the highest total incident count per area as well as the highest population normalized count per area.
Rates of Internet Access in EJ and Non-ej Areas
Source: ACS 2021 5-year estimates
Methodology notes: The population weighted average percent of households without access to the internet (home or cellular) was calculated for EJ census tracts and non-EJ census tracts based on ACS estimates of population and rates of internet access at the census tract level.
Ntas with the Highest Number of Lead Service Lines
Source: Department of Environmental Protection (DEP), Lead Service Line Location Coordinates, 2023.
Methodology notes: To calculate the service line-normalized number of lead service lines, service line records (available at the parcel record level) were filtered based on the material type listed. Lead service line records were joined to census tracts based on the centroid of the service line geometry, census tract totals were then aggregated to NTAs. Records categorized as ‘potential lead’ were considered to be possible lead service lines. This value was divided by the total number of service line records with either ‘not lead’ or ‘unknown’ material types for each census tract.
Noise Complaints
Source: New York City Office of Technology and Innovation, 311 Service Requests “Noise” complaints, 2022.
Methodology notes: The total number of 311 requests from 2022 of the type “Noise” were geocoded based on latitude and longitude and summed by NTA
Exposure to Polluted Water
Confirmed Backup Sewer Complaints
Source: NYC Department of Environmental Protection, 2022.
Methodology notes: The total number of 311 complaints in 2022 of the type “Sewer Backup” and “confirmed” were geocoded based on latitude and longitude and summed by NTA.
Water Quality Assessment for Recreational Use and NYC Parks “waterfront Facilities”
Source: NYS Department of Environmental Conservation, Division of Water, Bureau of Water Assessment and Management,” 2019. NYC Parks, “Parks Properties,” 2022.
Methodology notes: Waterbodies are mapped according to their water quality assessment for recreational use. NYC Parks properties with a type category field equal to “Waterfront Facilities” are mapped.
Exposure to Climate Change
Extreme Heat
Source: New York City Department of Health, Environment & Health Data Portal. Climate data. Heat vulnerability index (NTA), 2023.
Methodology notes: Percents of population within EJ areas for each HVI value were calculated by intersecting the census tracts with the HVI NTAs. Populations were estimated based on the proportion of the census tract area falling within or outside each NTA.
Coastal Storm Surge
Source: Mayor’s Office of Climate and Environmental Justice (MOCEJ),ixFormerly the Mayor’s Office of Long-Term Planning and Sustainability (OLTPS) Sea Level Rise Maps (2080s 100-year Floodplain), 2021. American Community Survey, 2017-2021 5 Year Estimates.
Methodology notes: Population and demographics of residents within the floodplain were calculated by intersecting the coastal flood plain with census tracts. Populations and demographics were estimated based on the proportion of the census tract area falling within or outside of the floodplain.
Source: Mayor’s Office of Climate and Environmental Justice (MOCEJ), Sea Level Rise Maps (2020s 100-year Floodplain), 2021. American Community Survey, 2017-2021 5 Year Estimates.
Methodology notes: Population and demographics of residents within the floodplain were calculated by intersecting the coastal flood plain with census tracts. Populations and demographics were estimated based on the proportion of the census tract area falling within or outside of the floodplain.
Chronic Tidal Flooding
Source: New York City Panel on Climate Change (NPCC), Future Tidal Flooding Due to Sea Level Rise, 2018. American Community Survey, 2017-2021 5 Year Estimates.
Methodology notes: Population and demographics of residents within the sea level rise were calculated by intersecting the future high tides with census tracts. Populations and demographics were estimated based on the proportion of the census tract area falling within or outside of the sea level rise.
Extreme Rainfall
Source: Department of Environmental Protection (DEP), NYC Stormwater Flood Map—Moderate Flood with Current Sea Levels, 2022. American Community Survey, 2017-2021 5 Year Estimates.
Methodology notes: Population and demographics of residents within the stormwater flood zones were calculated by intersecting the stormwater flood zones with census tracts. Populations and demographics were estimated based on the proportion of the census tract area falling within or outside of the stormwater flood zones.
Source: Department of Environmental Protection (DEP), NYC Stormwater Flood Map—Extreme Flood with 2080 Sea Level Rise, 2022. American Community Survey, 2017-2021 5 Year Estimates.
Methodology notes: Population and demographics of residents within the stormwater flood zones were calculated by intersecting the stormwater flood zones with census tracts. Populations and demographics were estimated based on the proportion of the census tract area falling within or outside of the stormwater flood zones.
Technical Supplement: Potential Improvements to the NYS Disadvantaged Communities Criteria
In 2019, New York State ratified the Climate Leadership and Community Protection Act, which set forth ambitious climate-focused goals, including GHG reduction requirements, as well as the need to identify the disadvantaged communities that bear the brunt of negative public health effects, existing and historical environmental pollution, and risk of future climate change impacts. As a result of this legislation, the State convened the Climate Justice Working Group, and along with subject matter experts, created and published a methodology for identifying disadvantaged communities (DACs).
The DAC identification methodology considers 45 indicators which describe various socio-demographic and environmental conditions across New York State’s census tracts. These indicators were selected from a larger body of available data comprised of over 100 variables based on data availability, fidelity, and relevance to describing climate justice at the census tract level.
The distillation of over 100 variables to 45 underscores some of the difficulties in capturing how environmental justice is experienced using quantitative data available at the state level. The indicators can only describe phenomena insofar as they are measured, and only at the intervals and scales at which data is collected and released. Facets of environmental justice that are not uniformly measured at the state level are not included in the DAC criteria. There are always differences between lived experience and the conditions that can be recorded through spatial data; datasets do not reflect real time changes nor do they generally capture the nuance and compounding conditions known by communities who have experienced environmental injustices.
Responsive to some of these inherent limitations, the DAC criteria methodology is designed to be updated over time: the State has mandated that the criteria shall be reviewed at least annually in order to improve the methodology where possible. The following analysis of the current criteria aims to contribute to this ongoing refinement and discourse.
Dacs in New York City
The Climate Justice Working Group determined a target of 35 percent of census tracts in New York State to be designated as DACs. Of the 4,918 census tracts in New York State, 1,736 (35.3 percent) are designated as DACs. Of these, 958 are in New York City, which represent 44 percent of the NYC census tracts and 55 percent of all DACs statewide.
An additional 29 census tracts in New York City are within one percentage point of the threshold used to determine which census tracts are designated as DACs, illustrating that small changes to the selection criteria can have notable impacts on DAC designation. This is significant as DAC designation will determine in part where state spending through the Climate Leadership and Community Protection Act is directed, with a target of 35 percent of this funding going towards DAC areas.
DAC Criteria Percentile Rank of Tracts
![]()
DAC Designated Census Tracts
Overview of the Current Methodology
The DAC designation methodology was developed by identifying over 100 potential input datasets and ultimately choosing 45 indicators which were deemed of the appropriate spatial and temporal scale; were based on observations and not proxy or modeled results where possible; and that were available across all of New York State.
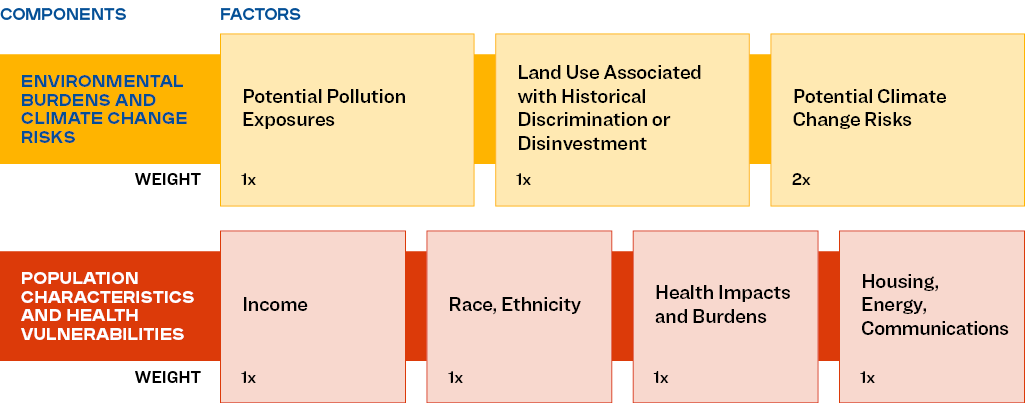
Individual indicators were grouped thematically and combined into seven factors. Weighted averages are taken within each factor to provide two component scores which are then summed to inform the final combined score.
Identification Factors and Components Used for the New York State DAC Criteria Methodology
This methodology strives to identify areas that exhibit high scores across both components (Environmental Burdens and Climate Change Risks as well as Population Characteristics and Health Vulnerabilities). However, as a result, there are certain areas in New York State that are not classified as DACs because they score highly in one of the individual components but not both. The following map below shows the geography of these component score disparities across the city in relation to areas that meet the DAC inclusion threshold.
This map displays the difference between Environmental Burdens and Climate Change Risk Score and Population Characteristics and Health Vulnerabilities Score. Deeper blue values denote areas with much higher environmental burden scores than population characteristics scores, and deeper red areas highlight the opposite condition.

This ultimately results in certain tracts with very high scores in one or the other category being excluded from DAC designation. As a result, certain areas that are deserving of attention, either from an environmental burden or public health perspective, do not meet the criteria for inclusion in the DAC. Of particular concern for this report are minority and low-income communities that may have experienced historical disinvestment and detrimental land uses and may experience environmental risks and burdens that are not captured by the current indicators in the criteria, but currently have low scores for Environmental Burdens and Climate Change Risk. Most census tracts in Southeast Queens, for example, are not designated DACs because they do not have a high score in the Environmental Burdens and Climate Change Risks component despite having a high score in the Population and Health Vulnerabilities component.
Comparison between Environmental Burdens and Climate Change Risk Score Percentile and Population Characteristics and Health Vulnerabilities Score Percentile for each tract in New York City. DAC-designated tracts with vulnerability scores of 0 are census tracts with fewer than 500 residents or 300 households which according to the DAC methodology are scored based solely on their burden scores.

Potential Improvements to the State Dac Criteria Methodology
Modifying the Dac Ranking System
A fundamental element of the DAC methodology is that it provides an understanding of burden relative to the rest of the state. A key step in determining this relative burden is to adjust for the extreme indicator and factor scores observed in New York City relative to the rest of the state. This adjustment is made using a multi-step ranking system that ensures that tracts from across New York State are included in the ultimate classification. However, it has the effect of excluding New York City census tracts that would otherwise be classified DACs.
As currently constructed, tracts in New York City are eligible to be included as DACs if they are within the top 29.8 percent of tracts statewide, or in the top 29.8 percent of tracts in the rest of New York State (excluding NYC). The secondary filter (adding tracts if they are within the top of the rest of New York State ranking) is designed to add to the share of DACs that are outside of New York City. In total, 44 percent of NYC tracts and 29 percent are tracts in the rest of the state are DACs based on the current methodology. If only the statewide ranking were used, 55 percent of NYC tracts would be included, and 20 percent of tracts in the rest of the state would be included.
Changes to DAC Census Tracts that Would Result from Using a Statewide Ranking Method Only
This map displays changes to DAC census tracts that would result from using a statewide ranking method only, instead of also separately considering rankings among tracts outside of NYC.

Modifying the Dac Indicators
Several indicators were identified that should be considered for inclusion or exclusion in future revisions to the DAC criteria.
Pluvial Flooding
The current DAC indicator related to inland flooding excludes pluvial flooding which occurs when extreme rainfall creates a flood independent of an overflowing water body. This is a major issue for New York City and other urban communities throughout the state, where this type of flooding is more prevalent due to a greater proportion of impervious surfaces. During Hurricane Ida, the confluence of stormwater flooding and housing insecurity caused devastating loss of life in below-grade apartments in NYC. The data currently employed in the DAC methodology to calculate this indicator were generated through projecting future flooding for streams in the US under a future climate change scenario and quantifying increased risk within current FEMA FIRMs . This dataset provides an important baseline understanding of inland flood risk from overflowing water bodies (fluvial flooding); however, the NYC Stormwater Flood Map – Extreme Flood with 2080 Sea Level Rise dataset, provided by the City of New York, provides a more complete understanding of inland flooding, incorporating pluvial flooding. Statewide analysis of stormwater flooding should be conducted so that this significant measure of climate change risk can be included for communities statewide. Adding this indicator to the current methodology would add 112 DAC census tracts in NYC and would cause 114 additional DAC designations to be redistributed to other tracts within NYC. More information on this updated measure can be found in the DAC Additional Indicator Methods call-out box.
Noise Pollution
Noise pollution was considered as an indicator in the drafting of the DAC criteria, however no dataset existed at that time. In November 2022, the US Bureau of Transportation Statistics (BTS) published the National Transportation Noise map, which represents the intensity of transportation-related noise pollution based on 24-hour equivalent sound levels for aviation, road, and rail-based transportation. While BTS outlines limitations of this dataset, it provides insight into the geography of noise pollution across New York State and is presented for consideration for inclusion in the DAC criteria in the future. Adding this indicator to the current methodology would add 129 DAC census tracts in NYC and would cause 81 additional DAC designations to be redistributed to other tracts within NYC. More information on this updated measure can be found in the DAC Additional Indicator Methods call-out box.
Proximity to Wastewater Discharge
This measure scores census tracts based on how close they are to polluted streams as measured by the EPA. The score is weighted by toxicity of the pollutants measured and includes all census tracts within 500 meters of streams for which there are data. This indicator identifies tracts along the East River and Long Island Sound in Manhattan, Queens, the Bronx, and Brooklyn, as well as tracts along Arthur Kill in Staten Island as tracts proximate to wastewater discharge. The current method used for this indicator allocates pronounced values in the above-mentioned areas, and no data values for most of Queens, Brooklyn, and Staten Island. In addition to the limited geography where this criterion is applied, proximity to wastewater discharge alone does not correspond with exposure to pollution for several reasons. The proximity-based measure does not distinguish between treated wastewater, which must meet effluent limits designed to ensure that water quality standards in the receiving water body are not exceeded, and untreated combined sewer overflow. Moreover, proximity does not necessarily lead to exposure. Independent of water quality, many of the waterbodies in and around the city are not suitable for swimming because of boat traffic or current, and the proximity metric does not take elevation or topography into account and includes large portions of upland neighborhoods unlikely to be impacted by this potential pollutant. It is highlighted for consideration for exclusion from the DAC criteria in the future. Removing this indicator from the current methodology would add 115 New York City census tracts as DACs and would cause 90 additional DAC designations to be redistributed to other tracts within NYC.
Housing Vacancy Rates
The rationale provided in the DAC criteria methodology states that this measure was included to measure disinvestment from a community; however, due to market dynamics and other factors, the highest rates of housing vacancy in New York City occur among high-cost and luxury housing. While this trend may vary for other portions of the state, including this variable for New York City does not capture the intended trends and it is highlighted for consideration for exclusion from the DAC criteria in the future; removing this variable from the overall criteria calculation adds an additional 116 DAC tracts to New York City, and redistributes an additional 89 tracts within NYC.
Combining the Potential Modifications to the Dac Criteria Methodology
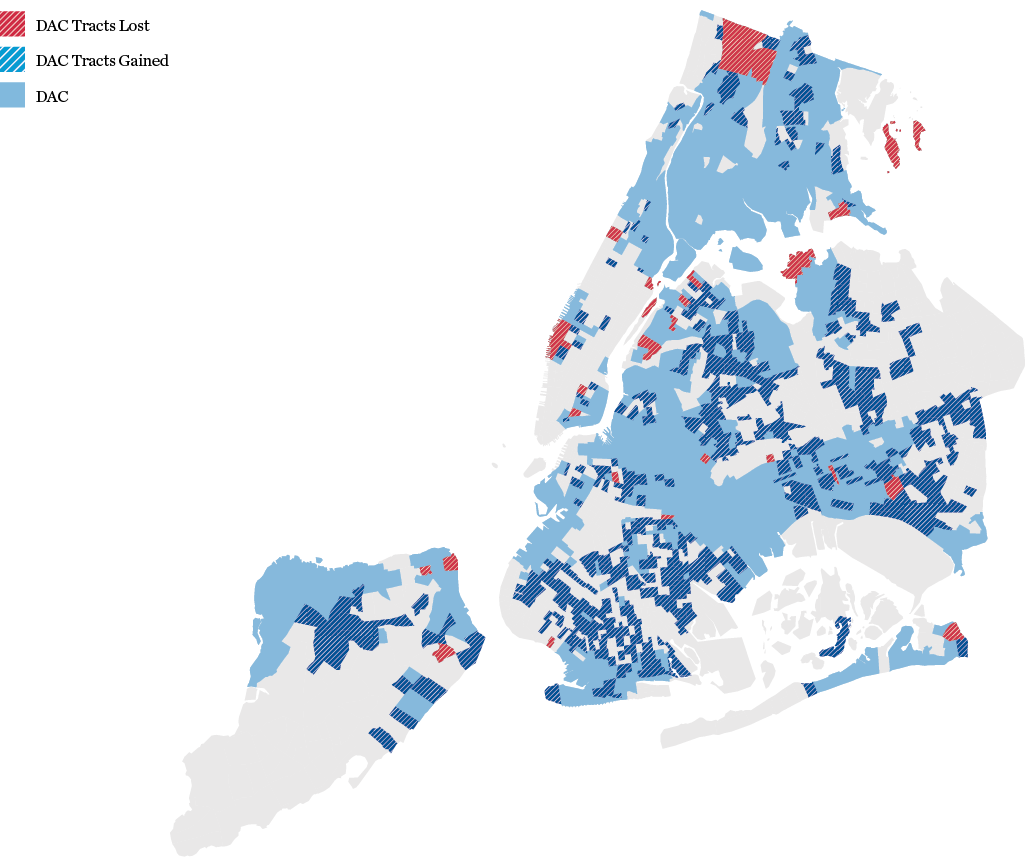
To illustrate the potential impacts of the combined adjustments to the DAC criteria outlined above a composite revision to the criteria was computed. This potential update to the DAC methodology used a statewide ranking only, added indicators for stormwater and noise, and removed indicators for wastewater and housing vacancy. The combined impact of these adjustments to the criteria would add 485 DAC census tracts in NYC and redistribute 15 tracts within the city. Using this method, 65 percent of census tracts in NYC would be DACs, compared with 12 percent of census tracts outside of NYC.
Map displaying changes to DAC census tracts that would result from using revised methodology that uses a statewide ranking, adds indicators for stormwater flooding and noise and removes current indicators for wastewater discharge and housing vacancy.
Taken together these convey considerations for the Climate Justice Working Group and NYS Department of Environmental Conservation in the next iteration of the DAC criteria methodology. This case-making analysis illustrates how the methods used impact which communities are considered DACs and which are not. The concerns outlined here should be considered as the Climate Justice Working Group and NYS Department of Environmental Conservation continue to refine the DAC criteria to best describe communities facing environmental and climate burdens in New York State.
Changes to DAC Status with Combined Updates to Method
Dac Additional Indicator Methodology
Pluvial Flooding
For the pluvial flooding indicator, this analysis used data from the NY Stormwater Flood Map – Extreme Flood with 2080 Sea Level Rise. This dataset was chosen because it is the publicly available stormwater flooding dataset that is most consistent with the flood risk and climate change projections used by the inland flooding indicator utilized in the original DAC Criteria in that it:
- Represents flooding from a 100-year flood event (consistent with existing DAC inland flooding indicator)
- Uses 2080 sea level rise anticipating 4.8 feet of sea level rise (existing DAC inland flooding indicator used 2100 projected sea level rise, but a lower estimate of 3 feet of sea level rise)
- This dataset contains data for three levels of stormwater flooding severity:
- Between 4 inches and 1 foot
- Greater than 1 foot
- Future high tides 2080
For each census tract, the percentage of each tract covered by flood zones of each severity was calculated. To account for these three levels of severity when combining the scores, they were then weighted accordingly: (1-3x the percentage calculated). These weighted percentages were then added together, and a percentile ranking was conducted to determine the final percentile ranking for each tract.
To develop a revised DAC score given the lack of equivalent stormwater flooding data for areas outside of NYC, the inland flooding indicator was used for the rest of the state and the new stormwater indicator was used for NYC. Combined scores were calculated based on these different indicators for NYC vs the rest of the state.
Noise
For the noise indicator, this analysis used data from the DOT National Transportation Noise Map for aviation, road, and rail noise. This is a raster dataset which records the distribution for all noise above 45dB(A) taking into account attenuation rate:
“Attenuation Rate: In this model, noise level attenuation is considered to be due only to ground effects and free-field divergence. Shielding is not considered (i.e. attenuation due to barriers and terrain are not considered). For this reason, noise levels may be over-predicted in areas near highway barriers or natural shielding features such as berms, hills, etc.”
For each census tract, the percentage of each tract’s area with noise over 45dB(A) was calculated. The threshold of 45dB(A) is the minimum value available in this dataset and was chosen because it is the threshold defined by the Word Health Organization as a maximum dB level for healthy noise exposure. A percentile ranking was conducted to determine the relative presence of noise pollution within census tracts in New York State.
Program/policy Spotlight Methodology
Overview
A program evaluation is a systematic method for collecting, analyzing, and using data to answer questions about the efficacy and efficiency of programs, and contribute to continuous improvement. They are typically used to examine whether particular a program is producing its intended effect. For the EJNYC Report, the program evaluation approach differed from a typical program evaluation as the mandate was to assess whether multiple City programs and processes advanced or exacerbated environmental justice concerns, regardless of whether they were intended to do so or not. Additionally, the scope of this analysis was limited due to time limitations and data availability. For this reason, the outputs of these evaluations are called “Program/Policy Spotlights” in this Report.
- This program/process evaluation was developed based on content requirements outlined in the EJ Report Scope. The EJ Report Scope is a formalized document chronicling input from a public scoping process that included thousands of comments from New Yorkers and determined the direction of the EJNYC Report. Per the Scope, the aim of the program/process evaluation is to examine existing city programs and processes that either advance environmental justice goals or exacerbate environmental justice concerns and examine processes may be used by the public to participate in City agency decision-making.
Key questions this evaluation set out to answer include:
- Which EJ concerns are impacted by the given program/process?
- Which groups and neighborhoods are most impacted? How closely does the program impact meet the scale and severity of the problem it is meant to address?
- How well-funded is the program and what is the distribution of investment throughout the city? Are funds and investments made equitably and proportional to the burden faced by different communities?
- Does the program pursue equity and environmental justice explicitly?
- What is the agency’s outreach process for sourcing public comments? What barriers impact public participation in environmental decision-making?
- How well are the outcomes of this program being monitored?
To conduct this assessment, a mix of quantitative and qualitative inputs were analyzed, including population data, program budgets, case studies, program monitoring reports, stakeholder conversations, and literature reviews of existing research. Due to data constraints, the depth of analysis varies and not every program, policy, and process could be evaluated against these questions.
Data Collection
Data collection for the program/process evaluation was a multi-phase process beginning with the curation of a comprehensive list of over 100 City programs and processes related to environmental justice concerns. This preliminary list was informed by a survey shared by MOCEJ to EJ IWG member agencies and inputs from the EJAB on relevant initiatives, policies, and actions which either advance or implicate environmental justice and/or relate to public engagement in environmental decision-making.
Following the creation of the preliminary list, a screening framework was used to screen each entry on the list to ensure only the most relevant programs/processes—and those that could be readily evaluated qualitatively or quantitatively—were moved forward to analysis. This screening framework was developed through an iterative process with feedback from MOCEJ, EJ IWG, and EJAB. The framework, shown below, is made up of two main parts – the first raising topical questions on the program’s suitability for the EJ evaluation, and the second addressing data quality and availability.
Program/Process Screening Process
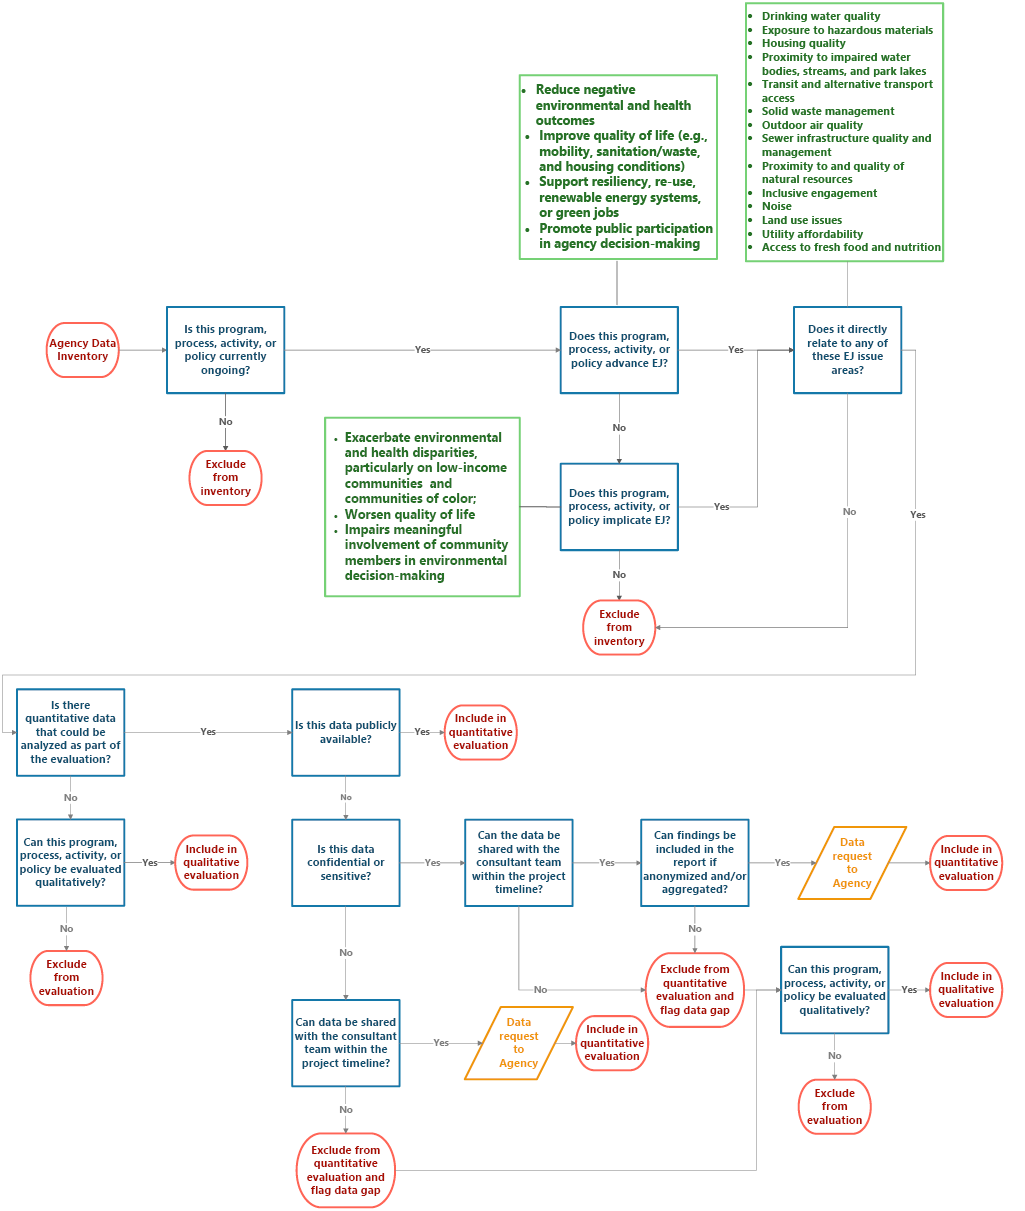
The EJ Report Scope required that each environmental concern listed in the Scope was represented at least once in the program/process evaluation. To satisfy this requirement, a second round of solicitation for relevant initiatives was conducted by MOCEJ. The logic model was applied to the additional initiatives. Ultimately, 33 programs/processes that either mitigate or exacerbate EJ concerns and 10 processes that facilitate public participation in environmental decision-making moved forward to the data sourcing phase.
Publicly available City data including geospatial layers, spreadsheets, press releases and program monitoring reports were obtained from NYC OpenData and agency websites. Additional research was conducted to source external data from research papers, articles, and books. In some instances where data gaps existed, non-published City data sources were identified through conversations between MOCEJ, EJ IWG member agencies, and the consultant team. However, much of these data could not be made available within the project timeline. This data gap led to a truncated selection of programs for evaluation and also limited the scope of analysis for some evaluated programs.
Data Analysis
Data analysis was conducted as appropriate for each program/process to answer the guiding questions outlined above. For the spatial and demographic analyses, 2010 census tracts were used alongside 2021 ACS 5-year Estimates unless otherwise stated. 2010 census tracts were used to maintain consistency with the New York State Disadvantaged Communities criteria which have been used throughout this evaluation as the definition of “EJ Areas.”
Get Stuff Built: Building and Land Use Approval Streamlining Taskforce
(BLAST) Plan
Qualitative analysis of the 2022 Get Stuff Built Plan was developed following literature review of the plan itself, the CEQR Technical Manual, ULURP rules, and the DOB permitting procedure alongside existing research around land use and environmental justice in New York City. The proposed actions were examined for their potential impact on EJ considerations, such as environmental review and infrastructure siting especially in EJ communities.
Vision Zero
Qualitative and quantitative data were used for this program spotlight. For the qualitative analysis, program reports were reviewed. Quantitative data used includes 2017-2022 Serious Injuries and Fatalities (KSI) data from NYPD and Vision Zero Street Improvement Projects data on NYC OpenData. A spatial join using the “contain” predicate was computed in GIS software to combine census tracts and crash data. The result was used to determine trends in the occurrence of KSI crashes in EJ Areas and non-EJ Areas.
In addition to KSI trends in EJ Areas versus non-EJ Areas, the KSI per mile metric was computed to determine locations with the most and least prevalent traffic safety concerns. This KSI crash density was calculated by dividing the number of KSI in each NTA by the total length of roadway within the tract boundary. The NTAs were then ranked by percentile with 0-10 having the lowest KSIs per mile and 90-100 having the highest.
A spatial join of census tracts and Street Improvement Projects (SIPs) at intersections and along street corridors contained in the tracts boundaries was computed to identify where investments have been directed. To compare the incidence of serious crashes and fatalities to program interventions, the ratio of SIPs to KSI per mile was computed follows:

Data gaps: this analysis only considers 2017-2022 and not the full program lifetime (beginning in 2013) because of data availability issues. An alternative NYSDOT dataset with 2013-2020 KSI crash data was explored but ultimately rejected in favor of the more recent NYPD 2017-2022 data.
Nyc Community Air Survey
This program spotlight was developed through a review of program reports published by DOHMH alongside air quality studies conducted by community-based organizations.
Nyc Clean Trucks Program
Qualitative and quantitative data from program reports, eligibility guidelines and citywide truck traffic studies were used to conduct this analysis. The program’s impact towards reducing truck emissions was measured by the number of replaced trucks divided by the number of trucks making daily crossings in and out of the city. This estimate assumed that each truck enters and leaves the city once daily, thus the total number of intercity trucks is equal to half the number of daily crossings in and out of the city.
Analysis of program eligible areas was performed by creating a 0.5-mile buffer around participating IBZs and selecting census tracts that fell at least partially within the buffer areas.
Hunts Point was excluded from the analysis of funding distribution in eligible IBZs because the neighborhood had an eight-year head start and an outsized level of funding compared to the other IBZs. Funding to non-domiciled trucks was also excluded from the analysis as there was no data on their locations, eliminating the possibility of any spatial analysis.
Environmental Remediation
Inputs for this evaluation include program reports, site enrollment data from program inception through 2022, and existing research on environmental remediation in New York City. Spatial joins of census tracts and VCP sites, and community districts and VCP sites were computed to examine the incidence of clean-up projects across the city and in EJ Areas compared to non-EJ Areas.
Demographic analysis was conducted by comparing 2010 ACS 5-year estimates to 2021 ACS 5-year estimates results for census tracts with VCP sites.
Data gaps: Confirmed knowledge of contamination in NYC is largely limited to sites where testing has been conducted as part of environmental review for land use approvals and special permits. As such, environmental contamination in neighborhoods with low development demand is likely to go undetected and untreated.
Alternative Enforcement Program
Qualitative evaluation for this program was developed using program reports, housing code enforcement rules, and the NYC Housing and Vacancy Survey.
Nycha Customer Contact
This program assessment mostly relies on qualitative inputs from the NYCHA website, press releases and quarterly reports from HUD’s independent monitor. Spatial analysis of distance between NYCHA developments and customer contact centers was conducted in GIS software.
Data gaps: This evaluation would have benefitted from access to NYCHA complaint, response, and resolution logs to assess the success of the Customer Contact program as well as other stakeholder criticisms around poor maintenance operations.
Cso Long-term Control Plans
This spotlight focuses on the distribution of stormwater infrastructure and investment in EJ and non-EJ Areas. Program funding amounts for completed projects in each sewershed were sourced from 2022 Q4 reports.
Spatial intersection was computed between LTCP sewersheds and census tracts to determine program impacts in EJ Areas vs. non-EJ Areas.
Lead Service Line Replacement
Qualitative assessment of DEP’s Lead Service Line Replacement pilot program program was developed using reports, insights obtained through conversations with DEP staff, and Drinking Water State Revolving Fund program documents.
Data gaps: The material composition of service lines in New York City is not fully known, with 16 percent of service lines potentially containing lead and 26 percent having unknown composition. As such, the scope of the challenge before DEP’s Lead Service Line Replacement program is not fully represented.
Cool Neighborhoods
Qualitative assessment for this program was developed using published reports from the City. Spatial analysis of Hyperlocal Temperature Monitoring data involved a spatial join of census tracts and monitor locations. ACS data for each census tract with monitors were aggregated to give demographic characteristics of benefitting neighborhoods.
Qualitative Research Methodology
New York City is home to an expansive network of competent, energetic and dedicated community leaders improving their neighborhoods and organizing to address the interconnected quality of life issues that comprise the environmental justice movement across the city. This leadership is found from the hyper-local, neighborhood scale to citywide and regional scales, and is present in both formalized leadership roles (such as at community-based and not-for-profit organizations, civic associations, and community boards), as well as informal roles (like those on the block in our neighborhoods, in school classrooms, and in local volunteers). They range in age from high school students to retired adults and are as diverse as the multitude of identities of the city itself. Through their persistent labors, these leaders and their communities have crafted visions, plans and achieved considerable successes and improvements in environmental justice and quality of life issues.
Through interviews and focus groups, the EJNYC Qualitative Research Team spoke with 42 New Yorkers living or working in environmental justice communities from across the five boroughs about the challenges they face with regards to the effects of environmental injustices, how they are managing these issues, and what their experiences have been in engaging with the City’s related programs and decision-making processes.
Qualitative Approach
The purpose of the qualitative assessment was to elevate the lived experiences of historically overburdened and underinvested communities in assessing the City’s historic and current contributions to environmental justice, with a focus on relevant City policies, programs, decision-making processes, public engagement practices, and access to data and information. The assessment was two-pronged in its approach, including both interviews with NYC environmental justice organizational leaders, as well as focus group sessions with everyday residents and community members on the ground in environmental justice communities, altogether seeking a limited, yet representative sample of both community members and formal leaders. All participants were compensated for their time and contributions.
Focus Groups with EJ Community Residents
The team held five focus groups virtually from late-August to early-October, reaching 22 New Yorkers across each of the five boroughs and throughout various neighborhoods identified as environmental justice communities. Participants represented a range of racial and ethnic identities, ages and gender identities, with 41 percent of participants identifying as Black or African American (followed by 23 percent identify as Asian, Native Hawaiian or Other Pacific Islander, Filipina) and 43 percent of participants identifying as of Hispanic, Latino or Spanish origin. The majority of participants (65 percent) identify as female, and nearly half of participants (47 percent) are between the ages of 25-44. One quarter (25 percent) of participants are NYCHA residents.
In the focus group sessions, participants were engaged with questions and conversation prompts ranging from “Share an experience where you were affected by an environmental issue. How did it affect you and how did you manage or resolve it?” to “What decision-making processes have you participated in (or not)? How was your experience? How should these processes change to lead to better outcomes for you and your community?”.
Interviews with Environmental Justice Organizational Leaders
The team also held sixteen interviews with environmental justice leaders, including two dozen executive directors of community-based and/or advocacy organizations, their staff, researchers who focus on NYC environmental justice and were recommended by community leaders, and NYCHA resident representatives. The Interviewees represented (or worked with) organizations that are based in communities across the five boroughs:
- 31 percent (5) in Brooklyn
- 13 percent (2) in the Bronx
- 19 percent (3) in Queens
- 13 percent (2) in Staten Island
- 25 percent (4) citywide, including two NYCHA representatives
Textual data from both the focus groups and interviews were reviewed, categorized, and interpreted through an iterative and inductive qualitative coding methodology, allowing insights and themes to emerge from the data and thus the voices of participants, rather than tested against a hypothesis. This assessment also included feedback and additional input from the NYC Environmental Justice Advisory Board, which includes representatives from across the city, including Manhattan-based organizations.
Supplement: City Programs and Initiatives
The following list is representative of City programs designed to address EJ issues. The list is not exhaustive but may serve as resource for individuals and organizations seeking programs and initiatives that address various EJ issues. The resources are organized by section from The State of Environmental Justice chapter and sorted chronologically, where applicable.
Access to Resources
Equitable Development Data Explorer (DCP & HPD)
Developed out of advocacy by the Racial Impact Study Coalition (RISC) and Public Advocate Jumaane Williams, the explorer uses data on housing and demographics to indicate the level of displacement risk in different neighborhoods.
Local Law 78 of 2021 (City Council)
LL 78 requires the preparation of Racial Equity Reports for certain land use changes, including a community profile from the Equitable Development Data Explorer, a narrative statement on the how the project affirms the City’s fair housing strategy, and the project’s anticipated housing units and jobs.
Racial Justice Commission (Charter Revision Commission)
In 2021, the City convened a Racial Justice Commission to examine barriers faced by people of color, propose revisions to the City Charter, and draft ballot proposals that forward racial equity. All three of the Commission’s final ballot measures, including the creation of Office of Racial Equity and a citywide Racial Equity Plan, were approved by a referendum of voters in November 2022.
Better Buses Action Plan (DOT & MTA)
DOT and MTA use equity metrics for prioritizing areas that can most benefit from speed and reliability improvements, including population of car-free households and low-income households. Many completed routes are in EJ communities, including the Bx12 SBS in Upper Manhattan and the Northern Bronx, the B44 SBS and B46 SBS in Bedford-Stuyvesant, Crown Heights, and Flatbush in Brooklyn, and the Q44 SBS connecting the Northern Bronx with the Flushing and Jamaica neighborhoods in Queens.
OMNY Fare-Capping Program (MTA)
The fare capping program allows transit riders who take more than 12 trips per week to ride free for the remainder of the week. This flexibility allows low-income riders to achieve savings over single ride fares without having to prepurchase an unlimited pass.
Metro-North Railroad Expansion (MTA)
Access to rapid transit plays a critical role in expanding access to economic opportunities by reducing commute times. The four new stations in Hunts Point, Parkchester/Van Nest, Morris Park, and Co-Op City will bring rapid transit service within a mile of 500,000 residents. The project, to be completed in 2027, will reduce travel time from the Bronx to Manhattan by as much as 50 minutes.
NYC Ferry Forward Plan (NYCEDC)
Introduced in Summer 2022, the plan aims to make the ferry system more equitable, accessible, and financially sustainable., including objectives to broaden outreach to NYCHA developments near the ferry landings and expand the discount program to offer $1.35 one-way tickets for seniors, people with disabilities, and other riders who participate in the Fair Fares NYC program.
Zoning for Accessibility (DCP, MTA, and MOPD)
To create a more accessible transit network, ZFA is a citywide zoning amendment that incentivizes private developers to build transit accessibility improvements in exchange for a density bonus.
Off-Peak Frequency Enhancements (MTA)
MTA introduced a plan to increase off-peak service by 2024, focusing enhancements on areas where subway ridership has recovered the highest from its pre-pandemic baseline. These enhancements can benefit workers in the outer boroughs with nontraditional work schedules that rely on off-peak transit service.
Free Fare Pilots (MTA)
Starting in September 2023, MTA will begin free fare pilots on five bus routes, one in each borough. The pilots will last 6-12 months on the following routes: Bx18 A/B, B60, M116, Q4 LCL/LTD, and S46/96. Routes were chosen based on a variety of factors, including ridership, equity for low-income and economically disadvantaged communities, and access to employment and commercial activity.
SAFEMicromobility (NYCHA)
Safe Access for Electric Micromobility (SAFEMicromobility) is NYCHA’s plan to provide safe and secure outdoor charging stations for electric micromobility devices like e-bikes and e-scooters to its residents. NYCHA has partnered with Con Edison for a demonstration project at four developments, and in June 2023, was awarded a $25 million federal grant through the U.S. Department of Transportation’s Rebuilding American Infrastructure with Sustainability and Equity (RAISE) program for the installation of 173 outdoor charging stations at 53 developments. This program promotes safety and equitable access to e-micromobility charging to residents in environmental justice communities.
Priority Investment Areas (DOT)
Through the NYC Streets Plan, DOT established Priority Investment Areas to act as a tool to focus future investment to where it can have the greatest impact. Identification of PIAs is based on the NTA’s percentage of non-white residents and low-income residents, job and population density, and previous DOT investment.
Fleet Safety Initiatives (DCAS)
DCAS has implemented a comprehensive set of road safety measures to bolster the overall safety of the City’s vehicle fleet. This includes the installation of surround cameras and backup sensors, the integration of intelligent speed assistance (ISA) to enforce maximum speed restrictions, and the establishment of the Fleet Office of Real-Time Tracking (FORT). FORT efficiently utilizes telematics to monitor the usage patterns of the City’s fleet. As a result of these proactive measures, along with other road safety initiatives, there has been a 23 percent decrease in preventable collisions involving City-owned vehicles (excluding NYPD) since 2019.
Community Parks Initiative (NYC Parks)
This initiative is designed to use future programming and park and playground rehabilitation efforts to address the historic disparities in park investment by identifying priority zones based on population growth, population density, and poverty rates. So far, the program has invested $285 million in 65 parks across the city, including in EJ communities in the South Bronx, Upper Manhattan, Central Brooklyn, and along the North Shore of Staten Island.
NYC Waterfront Public Access Study (DCP)
DCP conducted the Waterfront Public Access Study to better understand New Yorkers’ access to open space along NYC’s 520 miles of waterfront and to support the NYC Comprehensive Waterfront Plan released in December 2021. In addition to informing the Comprehensive Waterfront Plan’s Waterfront Public Access goals, the study findings will be used by DCP and other City agencies to support forthcoming waterfront zoning studies to expand waterfront public access.
Food Retail Expansion to Support Health (FRESH) (NYCEDC & DCP)
To support the expansion of fresh food sources, the FRESH program provides zoning and tax incentives to supermarket operators and developers. To date, 30 projects, predominantly in Upper Manhattan, Brooklyn, and the Bronx, have been approved, securing 2,000 jobs for their local communities. In 2021, DCP amended the program to limit oversaturation and expand the zoning boundary to more neighborhoods in the outer boroughs.
Mayor’s Office of Urban Agriculture (MOUA)
In the absence of grocery stores and supermarkets in many EJ communities, residents have launched urban farms and community gardens. Through collaboration with other City agencies, MOUA will promote the growth of urban agriculture through research, policy development, advocacy, and community outreach.
Health Bucks (DOHMH)
Health Bucks are $2 coupons that can be used to purchase fresh fruit and vegetables at New York City farmers markets. For every $2 spent at a farmers market using an EDT card, SNAP recipients receive $2 in Health Bucks, up to $10 a day.
Exposure to Polluted Air
Solar (DCAS, MOCEJ, NYCEDC, and NYCHA)
In One City: Built to Last the City has committed to achieve 100MW of solar energy generation on City-owned property by 2025 through multiple strategies which include large scale non-rooftop solar, and repair and replacement of high-priority rooftops. One City: Built to Last committed the City to assessing City building rooftops for solar readiness. The City is also working to support the installation of solar on privately owned buildings, and facilitate community solar projects that can benefit New Yorkers who do not own buildings. In addition to the City’s 100MW goal, NYCHA has committed to installing 30MW of rooftop solar by 2026. As of 2023, NYCHA has 19.7MW of solar in its pipeline via its ACCESSolar program and PACT developers: 6.7MW have been installed; 3MW are under construction; and a solicitation for another 10MW was released in April.
Offshore Wind NYC (NYCEDC)
NYC committed to $191 million in offshore wind investments over the next 15 years. Investments will focus on offshore wind sites and infrastructure, business and workforce development, and research and innovation to attract offshore wind development to the city.
Offshore Wind NYC Waterfront Pathways Program (NYCEDC)
Offshore wind development will bring good-paying clean energy jobs and contracting opportunities for NYC businesses. The Offshore Wind NYC Waterfront Pathways Program supports minority-owned, women-owned, and disadvantaged business enterprises in receiving contracts from NYCEDC to work on offshore wind opportunities.
Citizens Air Complaint Program (NYC DEP)
Allows citizens to participate in the enforcement of the idling laws by reporting an illegally idling vehicle. The Idling Complaint System enables citizens to file and track idling complaints and receive an award if the summons is upheld.
Clean Air (Port Authority of NY NJ)
The Port Authority of NY NJ has multiple environmental initiatives to address the air pollution impacts of ports and airports, including electrifying buses and other vehicles, adding electric vehicle charging stations for Port Authority customers, electrifying ground support equipment at airports, supporting the purchase of new, cleaner cargo handling equipment, incentivizing the use of clean maritime vessels, and supporting the use of sustainable aviation fuel.
Electrifying New York (NYC DOT)
Electrifying New York is an electric vehicle vision plan that lays out goals to support the adoption of electric vehicles over the next decade. The plan calls for expansion of fast charging networks, equipping parking lots and garages with chargers, advocating for additional funding, working with utilities to make it easier and cheaper to install electric vehicle chargers, engage with stakeholders and increase public awareness about electric vehicles.
NYC Clean Fleet Plan (DCAS and NYCHA)
NYC aims to be the most sustainable fleet in the country through the NYC Clean Fleet Plan, originally issued in 2015 and updated in 2021. NYC is working to reduce greenhouse gas emissions 50 percent by 2025 and will accelerate the transition of all light duty and medium duty on-road fleet vehicles, including law enforcement and emergency response models, and all non-emergency trucks to an all-electric on road fleet by 2035. Emergency and specialized trucks will be converted to electric models no later than 2040. In alignment, NYCHA released its own Clean Fleet Plan to reduce NYCHA’s vehicle-related carbon emissions by 40% by 2028. Additionally, NYCHA has collaborated with DCAS to host solar car-port electric vehicle charging stations at its developments.
Electric Micromobility Action Plan (Mayor’s Office)
The Mayor’s Office convened an Interagency Electric Micromobility Task Force to develop a Micromobility Action Plan to support New Yorkers in transitioning to safe and legal e-micromobility, prevent fires, prevent crashes, support delivery workers, promote sustainability and access, improve emergency response and educate the public about the safe use of electric micromobility.
Freight NYC (NYCEDC)
Freight NYC outlines four goals to address the air quality impacts of the city’s freight network. These goals include the creation of thousands of jobs in the freight sector, investing in maritime and rail infrastructure, modernizing and developing new distribution facilities, and building an environmentally sustainable and resilient supply chain.
Hunts Point Produce Market redevelopment (NYCEDC)
In September 2022, Mayor Eric Adams announced that the Hunts Point Produce Market would receive $110 million in federal grant monies to upgrade its facilities. The grant will be used to strengthen critical freight movement and improve the environment, public health, and quality of life for the Hunts Point community. The redevelopment of the Hunts Point Produce Market will eliminate about 1,000 temporary refrigeration units on site that are diesel-powered and idling on site. The new site will have an updated traffic circulation plan that will significantly reduce emissions attributed to onsite congestion and idling. There will also be a projected increase in rail usage, and installation of conduit to support future freight EV charging.
Idling Regulations (NYC Business)
The New York Anti Idling Law updated the New York City Administrative Code to disallow engines of motor vehicles from idling for longer than three minutes. This regulation does not apply to emergency motor vehicles or vehicles whose engine is used to operate loading, unloading, or processing devices.
MTA 2020 – 2024 Capital Plan (MTA)
In its 2020-2024 Capital Plan, the MTA committed to transitioning to a 100 percent zero-emissions fleet, starting with the purchase of 500 new electric buses.
NYC Clean Trucks Program (NYC Business)
The Clean Trucks Program offers rebates between $12,000 and $185,000 to replace older, heavily-polluting diesel trucks with electric, hybrid, or newer vehicles.
Curbside Composting (DSNY)
The Department of Sanitation is rolling out Curbside Composting citywide throughout 2024 following the successful implementation of a curbside composting program in Queens. All New Yorkers will be required to separate leaf and yard waste, food scraps, and food soiled paper for collection at the curb per the Council’s Zero Waste bills.
Drop-Off Composting Sites (DSNY)
Smart Composting Bins are available across the city for food scrap and plant waste drop-off, in addition to community-based drop off sites. New Yorkers need to download the NYC Compost app for iOS or Android in order to use the Smart bins.
Clean Curbs for All (NYCHA)
NYCHA’s Clean Curbs for All pilot is a hoist-collected waste containerization and electric trucks at five developments in South Brooklyn. Clean Curbs for All aims to reduce the pests at NYCHA developments by removing non-containerized trash from sidewalks, while mitigating the cumbersome and dangerous physical lifting and handling by NYCHA caretakers; truck pollution and noise associated with garbage pick-ups; and large open sources of trash, leading to cleaner developments and grounds.
Local Law 152 of 2018 (City Legislation)
In 2018, the Department of Sanitation was required to reduce permitted capacity at private transfer stations in Brooklyn Community District 1 by 50 percent and in Queens Community District 12 and Bronx Community Districts 1 and 2 by 33 percent to comply with the Waste Equity Law. These communities, which are primarily home to EJ communities, saw a majority of the city’s solid waste processed in their neighborhoods, an injustice which the Waste Equity Law addressed.
NYC Compost Project (DSNY)
The Department of Sanitation operates a citywide compost education and outreach program in partnership with botanical gardens and composting nonprofits in all five boroughs to provide workshops and technical assistance for home or community-based composting.
Solid Waste Management Plan (DSNY)
The Department of Sanitation’s Solid Waste Management Plan outlines the agency’s structure and strategies for managing the city’s solid waste through 2026. Efforts are underway to develop the next Plan, which will prepare for 2026 through 2036, and beyond.
Commercial Waste Zones (DSNY)
Local Law 199 of 2019 required the establishment of Commercial Waste Zones. These 20 zones were created to reduce commercial waste disposal and incentivize recycling, reduce truck traffic, provide fair pricing, strengthen customer service, improve training, safety, and labor standards, invest in clean fleets, and build resiliency in the city’s waste carting system.
Local Law 38 of 2015 (City Legislation)
Local Law 38 phased out the use of No. 6 and No. 4 fuel oils in multiple contexts, including backup power generation.
Local Law 43 of 2010 (City Legislation)
Local Law 43 phased out the use of No. 6 heating fuels in buildings by 2015, and No. 4 fuel oil by 2030.
Local Law 97 of 2019 (City Legislation)
Local Law 97 is one of the most ambitious plans to reduce building emissions in the nation. Most buildings over 25,000 square feet will be required to meet new energy efficiency and greenhouse gas emissions limits by 2024, with stricter limits coming into effect in 2030. The goal is to reduce the emissions produced by the city’s largest buildings by 40 percent by 2030 and 80 percent by 2050. The law also established the Local Law 97 Advisory Board and Climate Working Groups to advise the City on how best to meet these aggressive sustainability goals.
Local Law 154 of 2021 (City Legislation)
Local Law 154 phases out the use of fossil fuels in new construction starting in 2024, requiring that new buildings be all-electric. New York City is the largest city to require new buildings to be all-electric.
Local Law 32 of 2023 (City Legislation)
Accelerates the phase-out of No. 4 fuel oils by 2027 instead of 2030.
NYC Accelerator (MOCEJ)
Provides resources, training, and one-on-one expert guidance to help building owners and industry professionals improve energy efficiency and reduce carbon emissions from buildings in NYC.
Exposure to Hazardous Materials
Local Law 26 of 1988 (City Legislation)
The Community Right-to-Know (RTK) Program requires that NYC regulate the storage, use, and handling of hazardous substances that pose a threat to public health and the environment. Under the law, businesses are required to file annual reports detailing the quantity, location, and type of every hazardous substance stored in their facilities, which are archived in the Citywide Facility Inventory Database (CFID). The NYC Department of Environmental Protection releases yearly reports analyzing data from the CFID.
E-Designation (OER)
E-Designations identify properties that have environmental requirements relating to air, noise, or hazardous materials that must be investigated or addressed before the property can be redeveloped. An E-designation may be placed on a tax lot by the Department of City Planning or other lead agency in the course of a rezoning or other land use action. Sites with hazardous materials E-designations must be investigated, and OER must approve a cleanup plan based on the investigation’s results before a building permit can be issued.
Voluntary Cleanup Program (OER)
The release of PlaNYC in 2007 established New York City’s brownfield remediation and redevelopment initiatives, and the City created the Mayor’s Office of Environmental Remediation to promote cleanup and redevelopment of vacant contaminated land in NYC. The City signed into law the Brownfield Community and Revitalization Act to address light-to-moderately-contaminated lands that may not be eligible for the New York State Brownfield Cleanup Program and to streamline the cleanup process. In 2010, the City’s Voluntary Cleanup Program began accepting applications. By enrolling in the City Voluntary Cleanup Program, developers can receive grants, fee exemptions, certifications, liability protections, and other incentives to support remediation of contaminated properties. The program also involves release of cleanup plans to the public for notification and comment.
SAFE Disposal Events (DSNY)
SAFE (Solvents, Automotive, Flammables, and Electronics) Disposal events are hosted by DSNY every spring and fall in all five boroughs to provide New Yorkers with an opportunity to safely dispose of chemical products, medical waste, electronics, and other hazardous materials.
Special Waste Drop-off Sites (DSNY)
DSNY also operates a Special-Waste drop-off site in each borough, open a few days each month.
Access to Safe and Healthy Housing
Home Energy Assistance Program (HRA)
the Home Energy Assistance Program (HEAP) is a federally funded program that helps low-income homeowners and renters pay for utility and heating bills. In NYS, HEAP includes a Cooling Assistance benefit to help eligible households buy and install an air conditioner or fan.
NYC Accelerator (MOCEJ)
Provides resources, training, and one-on-one expert guidance to help building owners and industry professionals improve energy efficiency and reduce carbon emissions from buildings in NYC.
Enterprise Green Communities Criteria NYC Overlay (HPD)
All new construction and substantial rehabilitation projects receiving funding from HPD must comply with sustainability and energy efficiency criteria specific to the NYC context. As an alternative, the construction projects may pursue certification with LEED v4, gold or platinum.
Green Housing Preservation Program (HPD)
GHPP provides low- or no-interest loans to finance energy efficiency and water conservation improvements, lead remediation, and moderate rehabilitation work. The program is designed to assist small- and mid-size building owners improve building conditions and lower operating expenses to ensure the long-term physical and financial health of their buildings and to preserve safe, affordable housing for low- and moderate-income New Yorkers.
Cool Neighborhoods NYC (MOCEJ, formerly ORR)
This 2017 report launched a series of projects to locate cooling interventions in the city’s high-heat neighborhoods in order to mitigate the urban heat island effect. Strategies include targeted street tree planting and strategically installing green infrastructure and cool roofs.
ElectrifyNYC (MOCEJ, formerly MOS)
Launched in 2021 as part of an effort to help reduce greenhouse gas emissions from 1-4 family homes, ElectrifyNYC helps homeowners with green and efficient home upgrades so they can save money, make their homes more comfortable, and breathe cleaner air.
Induction Stove Challenge (NYCHA, NYSERDA, NYPA)
In December, NYCHA, in partnership with NYPA and NYSERDA, issued an RFP for the Induction Stove Challenge – a competitive innovation challenge that calls on appliance manufacturers to design and produce energy-efficient, electric cooking systems to replace existing fossil fuel stoves while avoiding costly electrical upgrades in NYCHA buildings. The Induction Stove Challenge complements an earlier partnership between NYCHA and the non-profit WE ACT for Environmental Justice. RFP responses are due by mid January.
City of Yes Carbon Neutrality (DCP, DOB, FDNY, MOCEJ)
Citywide zoning text change that will clear the way for the many green investments needed in our buildings to support the City’s climate goals.
Exposure to Polluted Water
Green Infrastructure Program (DEP)
DEP has successfully built over 12,000 green infrastructure installations across the city and continues to do so through its Green Infrastructure Program. These installations capture stormwater before it enters the sewer system. The projects range from rain gardens and infiltration basins, to green roofs and playgrounds with underground detention systems.
CSO Long-Term Control Plans (DEP)
On March 8, 2012, the New York State Department of Environmental Conservation (DEC) and DEP signed a groundbreaking agreement to reduce CSOs using a hybrid green and gray infrastructure approach. Building on DEP’s ongoing construction of CSO control infrastructure, under this agreement, DEP has developed 11 water-body-specific Long Term Control Plans (LTCP) to reduce CSOs and improve water quality in NYC’s water bodies and waterways. As part of these 11 plans, DEP has committed at over $6B in water quality capital investments. The goal of each LTCP is to identify the appropriate CSO controls necessary to achieve water-body-specific water quality standards, consistent with the Federal CSO Policy and the water quality goals of the Clean Water Act. On June 20, 2023, DEC and DEP signed a modified agreement that includes a commitment by DEP to fund $3.5 billion in green infrastructure projects citywide.
Industrial and Commercial Stormwater Program (DEP)
In the city’s municipal separate storm sewer system (MS4), DEP manages an Industrial and Commercial Stormwater Program to inspect permitted industrial and commercial facilities, enforce regulations, and assess unpermitted facilities to determine whether their stormwater contributions are regulated by the City’s State Pollution Discharge Elimination System (SPDES) permit.
Lead Service Line Replacement Program (DEP)
DEP is working with low-income homeowners to replace privately-owned lead service lines at no cost to the homeowner through the Lead Service Line Replacement Program.
Wetlands Management Framework (NYC Parks)
The 2020 Wetlands Management Framework for New York City provides a 30-year roadmap for the preservation, restoration, and management of all wetlands and streams in New York City with particular focus on those under the care of NYC Parks.
NYC Stormwater Resiliency Plan (MOCEJ, formerly MOR)
This 2021 report outlines the City’s strategies for managing vulnerabilities from extreme rain events, including strategies for improved flash flood response and the introduction of the City’s first Stormwater Flood Maps.
The New Normal Combatting Storm-Related Extreme Weather in NYC (Mayor’s Office)
Immediately after Ida in September 2021, the City released The New Normal, which accelerated much of the City’s stormwater resiliency work and committed to $2.5B in capital projects as well as $25M in programming.
Rainfall Ready (DEP)
Released in summer 2022, illustrating immediate actions the City and New Yorkers can take to prepare for extreme rainfall together.
Long Term Stormwater Resilience Vision (DEP)
Released on the one-year anniversary of Ida in 2022, outlining a green and grey multi-layered strategy to large rainfall events.
Cloudburst Management Program (DEP and Partners)
In January 2023, announced an additional $400M of investment in cloudburst design, expanding this resilient design strategy for large rain events to 4 new neighborhoods (Corona, Kissena Park, East New York, Parkchester) with more to come
Exposure to Climate Change
Get Cool NYC (NYCEM)
During the COVID-19 pandemic, older adults faced an increased risk of indoor heat exposure due to social distancing. Get Cool NYC aimed to address this risk by distributing air conditioning units to low-income older adults, totaling 16,000 AC units in NYCHA homes and more than 56,000 in non-NYCHA homes. This one-time, emergency program helped sensitive populations stay home safely; program participants were three times more likely to report staying home during hot weather in summer 2020 compared to non-participants.
Cool It NYC (NYC Parks)
Cool It! NYC is a Citywide plan to increase the amount of water features, drinking fountains, and tree coverage available to the public during heat emergencies, particularly in neighborhoods that face the dangers of high heat.
Cool Neighborhoods NYC (NYC Parks)
Through the Cool Neighborhoods NYC initiative, NYC Parks has planted 11,634 street and park trees in the most heat-vulnerable (HVI-5) neighborhoods, with an estimated 14,530 more trees to be planted through Spring 2024. The City committed an additional $112 million for the program to plant an estimated 36,000 additional trees per year in HVI-4 neighborhoods through 2026.
Cooling Centers (Multiple Agencies)
New York City opens cooling centers in air-conditioned, public facilities during extreme heat events to help prevent heat-related illnesses or deaths.
Clean Heat for All (NYCHA)
Through NYCHA’s Clean Heat for All (CH4A) program, NYCHA and its partners, NYPA and NYSERDA, are installing new window heat pumps in NYCHA’s residential apartments, which will provide reliable heating and cooling. This innovation challenge led to the award to two manufacturers, Gradient and Midea America, for the initial purchase of 30,000 units. This technology will not only provide residents with the autonomy to set their own heating and cooling, but it will decarbonize NYCHA’s buildings via space heating/cooling electrification.
Build It Back (NYC Housing Recovery)
Using $2.2 billion in federal Community Development Block Grant Disaster Recovery (CDBG-DR) dollars, Build It Back assists homeowners, renters, and landlords to coordinate repairs, rebuilding, and improvements of homes.
Coastal Resiliency Projects (MOCEJ)
Through OneNYC, the City committed $20 billion in communities across all five boroughs to protect New Yorkers from coastal storm surge. This work includes strategic infrastructure investments in EJ neighborhoods such as Edgemere, Queens; Red Hook, Brooklyn; Hunts Point, Bronx; and East Harlem, Manhattan.
Cloudburst Management Program (DEP and Partners)
Cloudburst management implements a combination of methods that absorb, store, and transfer stormwater to minimize flooding from cloudburst events. The most recent expansion of the program allocates nearly $400 million in capital funds to support infrastructure projects that will protect residents and property in Corona and Kissena Park, Queens, Parkchester, Bronx, and East New York, Brooklyn from future extreme weather brought about by climate change. DEP is partnering with Parks and DOT on implementation of these community-level infrastructure improvements. NYCHA is also working to implement cloudburst management strategies at properties at risk of stormwater flooding and is currently funded via capital funding of over $100M to design and build Cloudburst infrastructure at six NYCHA developments: South Jamaica, Woodside (Queens), Clinton (Manhattan), and Ingersoll, Nostrands, Breukelen (Brooklyn). NYCHA’s Cloudburst infrastructure projects will integrate resident amenities on NYCHA grounds into stormwater infrastructure design, providing both improvements to quality of life and protections against the hazards of climate change.
FloodHelp (MOCEJ)
FloodHelp is a platform for engaging and informing New York City homeowners about how they can protect their home and finances from flooding that is expected to worsen with rising sea levels caused by climate change.
FloodNet (MOCEJ)
FloodNet is a cooperative between academic researchers, community stakeholders, and City agencies to better understand the severity and frequency of tidal flooding in New York City. Low-cost flood sensors were installed across Jamaica Bay and Gowanus neighborhoods to collect hyper-local data on flooding to inform future resilience investments.
Zoning for Coastal Flood Resiliency (DCP)
The zoning amendment adjusts and makes permanent the temporary emergency zoning rules that made it easier for New Yorkers to rebuild post-Hurricane Sandy.
Recovery and Resilience (NYCHA)
NYCHA’s $3.2 billion Recovery and Resilience Program is the largest infusion of funds into public housing since NYCHA’s inception. The investment supports capital projects including building reinforcements, storm surge protection, and infrastructure upgrades.
Resilient Neighborhoods (DCP)
A place-based planning initiative to identify neighborhood-specific strategies, including zoning and land use changes, to support the vitality and resiliency of communities in the floodplain and prepare them for future storms.
RISE NYC (NYCEDC)
Through RISE:NYC, a CDBG-funded initiative, EDC is providing free resiliency technologies to small businesses affected by Superstorm Sandy to help them prepare for future storms and the impacts of climate change. EDC launched a competition in 2014 to identify market-ready technologies and selected 11 technology providers. The winning technologies include building systems solutions that improve the resiliency of critical building components during a storm, energy systems that provide clean resilient power to small businesses, and telecommunication networks that help businesses to stay connected. The first technology was installed in June 2017 by NYC Daylighting, a business located in Far Rockaway. RISE is deploying up to $28M to install at 400+ Sandy-impacted small businesses across the 5 boroughs.
Supplement: Advancing Environmental Justice
Ejnyc Surveying Initiative
If you have ever shared your input with the City, how would you describe your experience? Was it worthwhile? If not, what changes should be made?
- A total of approximately 800 responses for “values” were recorded. Responses ranged from one-word answers clearly identifiable as values to short sentences expressing both concrete suggestions and abstract ideas.
- The data from these responses was cleaned and coded with keywords in order to produce a frequency analysis shown in the graph below. From there, keywords were grouped into themes and values which establish the top four identified values. A second layer of coding was conducted to reveal themes within these top four values, to produce a more complete understanding of these values.
- The four most common values that respondents believed should inform City decision-making are: Community (49), Transparency (48), Sustainability (47), and Equity (45)
- Responses identified as representing the value of “Community” reflected themes including “Community Input,” “Community Engagement,” and the “Value to the Community” of City decision-making. Others focused on “Community Needs” or “Safety.” One respondent emphasized that City decision makers should “understand that the people who live in [EJ] areas know their environment,” while another expressed a desire for more engagement within communities by calling for “more Christmas potluck events.” Other related themes focused on: “The People” (as opposed to corporations or “corporate values”), “Diversity,” and “Culture.”
- Respondents also recommended “Transparency” as a value in environmental decision-making, relating to themes like “Honesty,” “Communication,” “Listening,” “Accountability,” “Accessibility,” “Authenticity,” and “Respect.” Respondents sought for clear communication, asking the City to “advertise issues and decisions clearly and provide context to New Yorkers so that they understand the details and issues,” and to “explain how/why decisions are made.”
- Sustainability was another common value, with some respondents simply stating “sustainability” or “the environment” as their response. Others focused on “Environmental Justice” and “Climate Justice,” while several made references to “Green Space,” “Parks,” “Pollution,” and “Remediation of Pollution”. Several also acknowledged links between sustainability and other areas, especially “Health.”
- Finally, many respondents expressed values related to “Equity”, which included themes like “Inclusion,” “Social Justice,” and “Antiracist Values.” Many expressed concerns over “Income Disparities” or inequality with one respondent stating that “having money does not make one community’s interests more important than another’s.” Other related responses focused on “Assistance” to communities with the most “Needs” and those that are the “Most Impacted” by climate change. Respondents also asked the city to “assist with day-to-day life” and in dealing with the problems that are “most common.”
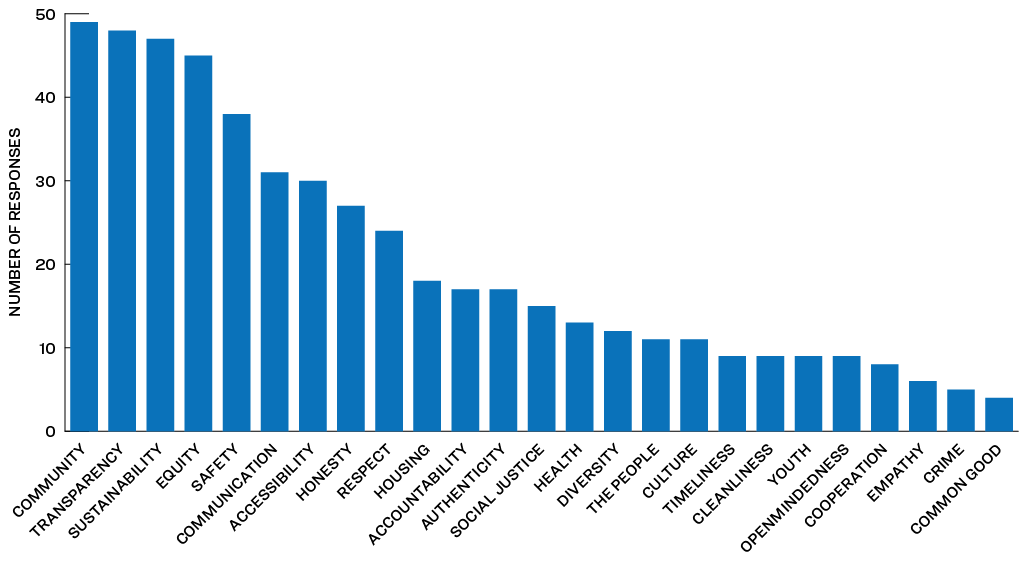
Discussion
- Values are the basis of action, policy, and decision-making. How the City carries out processes to increase meaningful involvement in environmental decision making is influenced by its values.
- What these values make clear is that environmental justice can only be achieved through the direct participation and involvement of impacted and marginalized communities in the identification, development, and implementation of policies decisions that directly impact them.
- Values described in this section should not be viewed independently from one another, many of them are related and can be connected to each other. Values gathered from everyday New Yorkers, who do not necessarily have the background knowledge of the EJ movement, are requesting the City to uphold values remarkably in line with the existing values of the movement.
- These values demand targeted efforts and investments in EJ communities to ensure residents are aware of when and how they can contribute to decision-making processes and for the City to effectively communicate how such involvement leads to City actions.
- The true goal of the environmental justice movement cannot be condensed into a legal definition. The vision of the movement is not to more equitably spread environmental harms, but to remove them entirely.
Municipal and State EJ Action Case Studies
Case studies of EJ actions by other state and municipal governments can provide helpful lessons for the future of EJ policies and initiatives in New York City. Many of these case studies document cumulative impacts and disproportionate burdens on communities of color and low-income communities and consider how siting and permitting decisions by government can work to address those issues. These actions have been regarded by legislators, advocates, and academics as essential to environmental justice. Some actions that are achieved in state contexts may be outside the City’s jurisdiction but provide valuable insight, nonetheless. The following section includes a summary of this policy review.
Municipal Actions
Chicago
Cumulative Impact Assessment (2023)
Chicago’s Cumulative Impact Assessment is citywide study exploring how environmental burdens and other stressors vary across Chicago communities. The baseline Assessment includes community input summaries, proposed environmental and health indicators, maps identifying impacted communities, an Environmental Justice Action Plan, and draft language for policy reforms. This Assessment is a crucial step toward promoting environmental justice in Chicago and aligns with the vision of the Healthy Chicago 2025 plan to address the root causes of health disparities. The City’s Environmental Equity Working Group (EEWG) provided guidance for the Assessment, and it serves as the accountability body throughout the process. Findings from the Assessment will inform future decision-making around policy initiatives and targeted investments.
Cincinnati
Environmental Justice Ordinance (2009)
With the passage of Ordinance No. 210-2009 (the “Environmental Justice Ordinance”) on June 24, 2009, Cincinnati became one of the first and only municipalities in the United States to codify its authority to deny development project permits solely based on environmental justice concerns. The Office of Environmental Quality would issue an “EJ permit” only if the project is not considered a “public nuisance,” which the ordinance defined as presenting “an excess cancer risk, excess risk of acute health effects, or excess risk in the event of an accident” according to EPA guidelines. Despite its successful passage, the ordinance faced strong opposition, and funding challenges ultimately stymied its implementation. The Cincinnati Regional Chamber of Commerce claimed that the Ordinance would slow economic development and that the Cincinnati municipal government could not afford the administrative costs of enforcing it. Indeed, the Ordinance was never implemented due to municipal budget constraints. The ordinance serves as a cautionary tale of the complexities of passing EJ legislation without sufficient implementation resources.
Los Angeles
Green Zones Program (2022)
The Green Zones Program aims to improve community health and quality of life for communities that have historically borne a disproportionate burden of exposure to pollution. The County established 11 “Green Zone Districts,” based on the high number of stationary sources of pollution near sensitive uses, like schools and parks. The selection of these neighborhoods was further informed by thorough community engagement and ground-truthing activities with local community organizations. Within Green Zone Districts, the County will prioritize enhancing residents’ well-being by implementing impact mitigation mechanisms and adding design requirements to address land use incompatibility near industrial and manufacturing areas.
Building Standards Ordinance 184245 (2016)
The Building Standards Ordinance was established to implement building standards and requirements to address cumulative health impacts resulting from incompatible land use patterns within the City of Los Angeles. It sets restrictions on the source of outside or return air for heating and cooling systems and requires air filtration for mechanically ventilated buildings, with higher standards for buildings in within 1,000 feet of a highway. These standards help reduce indoor exposure to air pollutants, improving indoor air quality for those in close proximity to stationary and mobile source of pollution.
Newark
Environmental Justice and Cumulative Impacts Ordinance (2016)
Newark’s Environmental Justice and Cumulative Impacts Ordinance, passed in 2016, amended the City’s zoning regulations to require all developers with county, state, or federal environmental permits seeking land use approvals or zoning variances to submit an Environmental Review Checklist for review by the City’s Environmental Commission. Unlike the State of New Jersey’s recent EJ law, the Newark ordinance does not require the City’s planning or zoning board to deny an application solely based on a negative environmental justice review, but it does provide the boards with additional information about the proposed project’s potential environmental impact in light of existing community conditions. The Environmental Review Checklist is informed in part by the City’s Natural Resources Index (NRI), which provides a baseline of environmental and socio-economic conditions against which the impacts of proposed projects can be considered. The index includes information on natural resources, physical infrastructure, numerous health indicators, existing pollution sources, locations of vulnerable populations and social infrastructure, and additional socio-economic data.
San Francisco
Environmental Justice Framework (2023)
The City and County of San Francisco’s Environmental Justice (EJ) Framework establishes a clear set of vision statements and policy priorities to guide its future efforts to advance health in communities of color and low-income communities. Under SB 1000, cities and counties across California are required to analyze data related to EJ communities and adopt policies in their General Plans to address the “unique or compounded health risks” experienced by these communities. San Francisco’s EJ focus areas, adapted from SB 1000, cover topics ranging from physical activity to climate resiliency to safe housing. The Healthy Food Access topic, for example, is driven by a vision of food security for all San Franciscans. Priorities for this topic include expanding programs that provide access to healthy and culturally appropriate food; leveraging the local food system to meet public health and workforce development goals; and fostering a more climate resilient and carbon-neutral food system. Similar to the goals of the forthcoming EJNYC Plan, San Francisco’s EJ Framework aligns EJ actions across local agencies to deliver cross-cutting benefits to the city’s most impacted residents.
Health Code Article 38 (2008/2014)
Adopted in 2008, San Francisco’s Health Code Article 38 requires that residential construction projects located in areas with poor air quality install enhanced ventilation systems. The City developed an Air Pollutant Exposure Zone, based on emissions modelling from pollutant sources including regulated stationary sources and major roadways. Following amendments to the code in 2014, developers of residential projects located within the Zone must design a ventilation system “capable of removing >80 percent of ambient PM2.5 from habitable areas of dwelling units.” Article 38 grounds its requirements in conclusive scientific research that not only demonstrates the deleterious health consequences of living close to air pollution sources like highways, but also that proximity to air pollution sources is more common for lower-income communities and communities of color.
Environmental Justice Program (2001)
The San Francisco Department of the Environment oversees an Environmental Justice Program, with a focus on addressing health disparities, improving air quality, and promoting energy justice. Collaborations through the program are wide-ranging, including working with the SF Housing Authority to minimize toxic pesticide use and EJ organizations to advocate for the closure of high-polluting power plants. The Department also administers its own Environmental Justice grant program, which has provided over $12 million in funds to non-profit groups to support community EJ projects. The program concentrates its resources on the southeast area of the city, which has historically experienced greater exposure to environmental justice hazards.
Santa Monica
Zero Emission Delivery Zone (2022)
Santa Monica collaborated with the Los Angeles Cleantech Incubator (LACI) to launch the first Zero Emission Delivery Zone (ZEDZ) Pilot in the country. The pilot, which ran until December 2022, encouraged the use of clean, electric delivery vehicles by providing priority curb space in a designated one-square mile test zone. It tested different types of zero emission transportation technologies, charging infrastructure, curb access, and policy incentives. The goals of the ZEDZ were to establish a blueprint for other cities, provide learnings to delivery companies, benefit the community by reducing pollution and congestion, and offer economic opportunities to small businesses and individuals. The program aimed to address the externalities from the overall increase in deliveries and contribute to Santa Monica’s efforts to reduce pollution, congestion, and greenhouse gas emissions. PlaNYC, New York City’s strategic climate plan, includes goals for zero-emissions freight zones.
Montgomery County, MD
Bill 24-19—Air Conditioning (2020)
In 2020, Montgomery County passed an ordinance enacting new standards for landlords’ provision and maintenance of air conditioning. Air conditioning is a critical adaptive measure for preventing heat stress during high heat days. Through the ordinance, landlords are responsible for maintaining an indoor air temperature of no more than 80 degrees in properties where tenants do not control air conditioning in their units. Where tenants are in control of cooling, landlords are responsible for providing an air conditioning system capable of maintaining a temperature of no more than 80 degrees. Through PlaNYC, New York City commits to develop its own maximum summer indoor temperature policy to protect all New Yorkers from extreme heat by 2030.
Dallas
Air Conditioning Requirement (2016)
Like Montgomery County, Dallas has its own air conditioning requirements within its minimum housing standards. Landlords are required to provide and maintain air conditioning equipment capable of maintaining a room temperature of at least 15 degrees cooler than the outside temperature, but in no event higher than 85°F in each habitable room.
Fulton County, Ga
Fulton County Environmental Justice Initiative (2010)
In 2010, Fulton County’s Board of Commissioners approved funding to implement an Environmental Justice Initiative (EJI). The initiative is driven by the idea that no demographic group is disproportionately affected by adverse environmental conditions, no matter race, income, or another social factors. The initiative has resulted in several new policies and amendments to address countywide disparities, including zoning amendments to mandate minimum separation distances between environmentally adverse uses and environmentally-stressed communities. Additionally, environmental justice is embedded into the County’s 2016 Comprehensive Plan, with its own chapter outlining strategies to create a brownfield inventory, developing EJ guiding principles, and integrating procedural equity into environmental planning processes. The Fulton County initiative is a successful example of an environmental justice framework shaping local policy.
State Actions
California
SB 535 and CalEnviroScreen (2012)
Through Senate Bill 535, California requires that 25 percent of all capital from its Greenhouse Gas Reduction Fund (GGRF) go towards projects benefiting disadvantaged communities. The Fund primarily receives its revenue from the auction of allowances from the State’s cap-and-trade program. Funding must support efforts that further reduce emissions of greenhouse gases, such as solar panel installation, weatherization programs, public transportation improvements, and green infrastructure projects.
The CalEnviroScreen tool, developed by CalEPA, is used guide the allocation of funds from the GGRF. CalEnviroScreen is designed to address environmental justice concerns by identifying communities that face a higher burden of environmental pollution and socio-economic challenges. The tool considers multiple indicators, such as air quality, exposure to toxics, socioeconomic factors, and health vulnerabilities, to create a composite score that reflects a community’s relative vulnerability. The tool informs other state and local planning efforts, as well as providing residents the ability to understand and identify environmental hazards in their own communities.
SB 1000 – EJ in Local Land Use Planning (2016)
The California legislature adopted SB 1000 to integrate environmental justice considerations into local planning processes and address the disproportionate burden of environmental harms experienced by marginalized communities. The bill mandates that jurisdictions with disadvantaged communities include an environmental justice element in their general plan or integrate environmental justice goals throughout other plan elements. Disadvantaged communities, in this case, refers to communities that experience compounding pollution burdens and population vulnerabilities according to the State’s CalEnviroScreen tool. Jurisdictions with disadvantaged communities must also establish policies to reduce health risks and promote civic engagement and prioritize improvements for disadvantaged communities.
New Jersey
Environmental Justice Law (2020)
New Jersey’s Environmental Justice Law requires the State’s Department of Environmental Protection (NJDEP) to incorporate evaluations of the environmental and public health impacts of certain facilities into the permitting process. While other states and municipalities have required applicants to prepare environmental justice impact statements or conduct public hearings, New Jersey’s law was the first to require mandatory permit denials for facilities that contribute to cumulative environmental or public health stressors on EJ communities. Acknowledging the disproportionate siting of polluters in the state’s low-income communities and communities of color, the legislation seeks to correct this historical injustice by limiting the further concentration and expansion of certain facilities in overburdened communities, which the State defines as census block groups with at least 35 percent low-income households, 40 percent minority or tribal community residents, or 40 percent households with limited English proficiency. The landmark legislation was the result of a decades-long effort by a diverse coalition of EJ advocates and served as a helpful precedent for subsequent legislation in other states such as New York and Maryland.
New York
S8830 – Cumulative Impacts Bill (2023)
New York State’s 2023 Cumulative Impacts Bill aims to address the cumulative impacts experienced by EJ communities overburdened by pollution. Living in close proximity to mobile and stationary sources of pollution can have negative impacts on health and well-being. These negative consequences are exacerbated when multiple sources of solution are sited in the same neighborhood. This bill prevents the approval and re-issuing of permits for actions that would increase or perpetuate disproportionate pollution burdens on disadvantaged communities. Moving forward, City agencies will need to assess existing pollution conditions around future projects and incorporate EJ considerations into their planning decisions.
NYSERDA Disadvantaged Communities Stakeholder Services Pool (2022)
NYSERDA recognizes the disproportionate impact climate and environmental hazards have on historically marginalized communities. Thus, it seeks to center the experiences of frontline communities in the development of future energy policies and investments. To facilitate this, the agency is forming a Disadvantaged Communities Services Pool to work with NYSERDA staff in implementing initiatives that support the state’s transition to a clean economy. The pool will consist of community leaders and advocates representative of the state’s DACs, and the paid work will include consultation, program and policy input, engagement facilitation, and working group participation. Notably, at least 35 percent of clean energy investments, as part of the State’s Climate Leadership and Protection Act, are to be directed towards DACs. Therefore, this close collaboration and advisory is essential for realizing the State’s climate and equity goals.
Massachusetts
Environmental Justice Policy and Bill S.9 (2021)
In 2002, the Massachusetts Executive Office of Environmental Affairs (EOEA) adopted its first formal Environmental Justice Policy. The extensive list of measures included the development of criteria to identify the state’s EJ populations, the establishment of an inter-agency EJ Working Group, and the requirement of “enhanced” public participation and impact analyses for certain projects undergoing state environmental review, notably those within 1 mile of EJ populations. Initially, the policy was not codified into state law, which meant that its implementation could vary across administrations. This eventually changed in 2021 with the passage of Bill S.9, “An Act Creating a Next Generation Roadmap for Massachusetts Climate Policy.” With the new climate law, Massachusetts codified the socio-economic criteria for EJ population identification, requirements for mandatory environmental impact reviews, and considerations for public participation. Notably, the new legislation added additional public participation measures for projects affecting EJ populations. The requirements include providing translation services, ensuring public meetings are accessible via public transit, providing information on project review, and establishing repositories of relevant documents. Researchers suggest these new requirements could be pivotal in protecting communities from disproportionate impacts, ensuring transparency and language access, and even preventing inequitable project approvals.
Maryland
HB 1200 (2022)
Maryland’s HB 1200 serves as another statewide example of using policy and data to prevent the overburdening of EJ communities. The bill requires applicants for permits related to polluting infrastructure (i.e. hazardous substance facilities, nuclear waste facilities, landfills, etc.) include the Maryland EJ Score for the census tract where the applicant is seeking a permit. The EJ Score comes from the State’s own EJ mapping tool, Maryland EJScreen. The tool borrows the scoring methodology from CalEnviroScreen, combining a pollution burden score and a population characteristics score to assess overall burden. The Maryland Department of the Environment (MDE) takes this information into account in its review of the permit to reduce to cumulative impacts on impacted neighborhoods.
Washington
Environmental Justice Task Force (2019) and HEAL Act (2021)
The Washington State Environmental Justice Task Force (EJTF), comprised of diverse representatives across State government, community organizations, organized labor, and the private sector, was responsible for developing strategies to incorporate EJ principles into future State agency actions. The final 25 policy recommendations became the basis for the Healthy Environment for All (HEAL) Act, signed into law in 2021. The HEAL Act codifies the definition of environmental justice in state law and outlines its application within state agency operations. The law specifies that State agencies are to incorporate EJ principles into their budgeting decisions, with a goal of directing 40 percent of grants and expenditures that create environmental benefits to vulnerable populations and overburdened communities. Additionally, agencies are required to incorporate an environmental justice implementation plan into their broader strategic plans, including performance metrics to track progress towards goals and actions. Noting the importance of community-based organizations in moving this work forward, the legislature subsequently passed a budget proviso establishing an “Environmental Justice Community Participation Fund” to provide grants to community-based organizations to enable access and participation in HEAL Act implementation.
Abbreviations
“M” Manufacturing zoning
“R” Residential zoning
AADT Average Annual Daily Traffic
ACS American Community Survey
AEP Alternative Enforcement Program
Air Code Air Pollution Control Code
AMI Area Median Income
AQS Air Quality System
BC Black Carbon
BCA Benefit-Cost Analysis
BEPA Bureau of Environmental Planning and Analysis
BK Brooklyn
BLAST Building and Land Approval Streamlining Taskforce
BRIC Building Resilient Infrastructure and Communities
BTS Bureau of Transportation Statistics
BX Bronx
C&D Construction and Demolition
CAPA City Administrative Procedure Act
CB Community Board
CBO Community-Based Organizations
CCC Customer Contact Center
CCHR New York City Commission on Human Rights
CD Community District
CDBG Community Development Block Grant
CDBG-DR Community Development Block Grant Disaster Recovery
CEC Civic Engagement Commission
CEJST Climate and Economic Justice Screening Tool
CEQR City Environmental Quality Review
CERCLA Comprehensive Environmental Response, Compensation and Liability Act
CFID Citywide Facility Inventory Database
CH4A Clean Heat for All
CHMA Crown Heights Mutual Aid
CLCPA New York State Climate Act or Climate Act
CNG Compressed Natural Gas
CORE Congress of Racial Equity
CPC City Planning Commission
CRAT Climate Risk Assessment Tool
CSC Climate Strong Communities
CSO Combined Sewer Overflows
CUNY City University of New York
DAC Disadvantaged Communities
DCAS Department of Citywide Administrative Services
DCP Department of City Planning
DEC Department of Environmental Conservation
DEP Department of Environmental Protection
DERTA Division of Emergency Response and Technical Assessment
DOB Department of Buildings
DOC Department of Corrections
DOE Department of Education
DOHMH Department of Health and Mental Hygiene
DOT Department of Transportation
DPR Department of Parks and Recreation
DSNY Department of Sanitation
ED Emergency Department
EDC Economic Development Corporation
EELS Environmental Enrichment and Leadership for Students
EEWG Environmental Equity Working Group
EJ Environmental Justice
EJAB Environmental Justice Advisory Board
EJG2G Environmental Justice Government-to-Government program
EJI Environmental Justice Initiative
EJNYC Environmental Justice New York City
EJTF Washington State Environmental Task Force
EOEA Massachusetts Executive Office of Environmental Affairs
ERP Emergency Repair Program
FDNE Frequent Disruptive Noise Exposure
FEMA Federal Emergency Management Agency
FHA Federal Housing Administration
FIRM Flood Insurance Rate Map
FMA Flood Mitigation Assistance
FRESH Food Retail Expansion to Support Health Program
FVI Flood Vulnerability Index
GFO GreenFeen OrganiX
GGRF Greenhouse Gas Reduction Fund
GHG Greenhouse Gas
HEAL Healthy Environment for All
HEAP Home Energy Assistance Program
HOLC Home Owners’ Loan Corporation
HOLC D a ‘D’ or ‘hazardous’ rating by the Home Owners Loan Corporation
HPD Department of Housing Preservation and Development
HUD U.S Department of Housing and Urban Development
HVI Heat Vulnerability Index
HVS Housing and Vacancy Survey
IBZ Industrial Business Zones
IIJA Infrastructure Investment Jobs Act
IRA Inflation Reduction Act
IWG Interagency Working Group
KSI Killed or Severely Injured
kW kilowatt
LACI Los Angeles Cleantech Incubator
Law New York City Law Department
LiDAR Light Detection and Ranging
LISC Local Initiatives Support Corporation
LTCP Long Term Control Plan
M/W/DBE Minority, Women-owned, and Disadvantaged Business Enterprise
MDE Maryland Department of the Environment
mgy million gallons per year
MN Manhattan
MOCEJ Mayor’s Office of Climate and Environmental Justice
MODP Mayor’s Office for People with Disabilities
MOIA Mayor’s Office of Immigrant Affairs
MOUA Mayor’s Office of Urban Agriculture
MS4 Municipal Separate Storm Sewer Systems
MSC Movement Strategy Center
MSW Municipal Solid Waste
MTA Metropolitan Transportation Authority
MW Megawatt
NEI National Emissions Inventory
NHGIS National Historic Geographic Information System
NJDEP New Jersey’s Department of Environmental Protection
NO Nitric Oxide
NO2 Nitrogen Dioxide
NOx Nitrogen Oxides
NPCC New York City Panel on Climate Change
NRI National Resources Index
NSWC North Shore Waterfront Conservancy of Staten Island
NTA Neighborhood Tabulation Areas
NYC New York City
NYC New York City
NYC DEC New York State Department of Environmental Conservation
NYC DoITT New York City Department of Information Technology and Telecommunications
NYC- EJA New York City Environmental Justice Alliance
NYC Opportunity Mayor’s Office of Economic Opportunity
NYCCAS New York City Community Air Survey
NYCEDC New York City Economic Development Corporation
NYCEM New York City Office of Emergency Management
NYCHA New York City Housing Authority
NYCIDA New York City Industrial Development Agency
NYISO New York Independent System Operator
NYPA New York Power Authority
NYPD New York Police Department
O3 Summertime Ozone
OATH Office of Administrative Trials and Hearings
OEC Mayor’s Office of Environmental Coordination
OER Mayor’s Office of Environmental Remediation
OMB Mayor’s Office of Management and Budget
Ops Mayor’s Office of Operations
PACT Permanent Affordability Commitment Together
PBNYC Participatory Budgeting in New York City
PERC perchloroethylene
PIA Priority Investment Area
PM2.5 Fine Particulate Matter
PSC Public Service Commission
PTA Parent-Teacher Associations
PUMA Public Use Microdata Area
QN Queens
RAD Rental Assistance Demonstration
RCRA Resource Conservation and Recovery Act
RETI Resilience, Education, Training, and Innovation
RFP Request for Proposal
RISC Racial Impact Study Coalition
RTK Right-to-Know Program
SAFE Solvents, Automotive, Flammables, and Electronics
SBS Select Bus Service
SEQRA State Environmental Quality Act
SI Staten Island
SIP Street Improvement Project
SMIA Significant Maritime Industrial Area
SNAP Supplemental Nutrition Assistance Programs
SNEEJ Southwest Network for Economic and Environmental Justice
SNI Supermarket Needs Index
SO2 Sulfer Dioxide
SOx Sulfur Oxides
SPDES State Pollution Discharge Elimination System
SUN Solar Uptown Now
SWMP Solid Waste Management Plan
TRI Toxic Release Inventory
TSDF Treatment, Storage, and Disposal Facility
UHF42 United Hospital Fund Neighborhoods
UHIE Urban Heat Island Effect
ULURP Uniform Land Use Review Procedure
US EPA United States Environmental Protection Agency
USACE United States Army Corps of Engineers
VCP Voluntary Clean-up Program
VIA Vulnerability, Impact, and Adaptation
WRRF Wastewater Resource Recovery Facilities
ZEDZ Zero Emission Delivery Zone
Environmental Justice Advisory Board Comments and City Responses
Comment 1: Land Use Planning and Zoning: This section does not acknowledge that potential negative impacts of rezoning (displacement and cultural erasure) and the inequities in neighborhood rezoning
Response 1: Thank you for your comment. Community groups and local elected officials have raised concerns about displacement and cultural erasure, and historically, some rezonings contributed to these processes by reducing the city’s housing supply. The City is taking steps to use zoning to increase housing capacity, which has been shown to alleviate high rents, displacement and gentrification pressure, segregation, overcrowding, homelessness, tenant powerlessness and more, and focus attention on the effects – positive or negative – of larger land use actions, such as rezonings.
As outlined in Where We Live NYC – the City’s fair housing plan mandated by the US Department of Housing and Urban Development – high housing costs, segregation, gentrification and displacement pressure, overcrowding, and even homelessness emerge from New York City’s severe and longstanding housing shortage. As the city’s economy and population grow, the lack of housing means that historically affordable neighborhoods see an influx of newcomers able to pay higher rents than residents who’ve been there for decades or even generations. This dynamic was intensified by the 1961 rezoning, which decreased housing capacity throughout much of the city, and more recent actions, such as low-density downzonings prevalent in the 2000s, that closed off many higher-demand areas to more housing. Rezonings that enable more housing help to relieve these pressures, and this is the impetus behind the City of Yes for Housing Opportunity proposals, which seek to enable a little more housing in every neighborhood across the city, especially high-demand areas that currently have exclusionary zoning.
To help focus attention on these effects – positive or negative – of larger land use actions, the City has also implemented a system of Racial Equity Reporting pursuant to Local Law 78 of 2021. These reports draw on the Equitable Development Data Explorer, a companion effort that makes demographic, economic, and other data available at sub-borough geographies, and require applicants to evaluate covered land use actions in light of the goals enunciated in Where We Live. This means, for instance, that decision-makers can no longer approve a downzoning of a wealthy area ignorant of the likely implications for fair housing goals.
Comment 2: Land Use Planning and Zoning: Missed opportunity to mention City of Yes for Carbon Neutrality
Response 2: Thank you for your comment. Based on this feedback we have added a callout box on City of Yes for Carbon Neutrality on page 58.
Comment 3: Exposure to Polluted Water: Is there any data on basement apartment occupation by race and/or income? This would illustrate any disparities in who is at risk of exposure to stormwater flooding.
Response 3: Thank you for your comment. Improving safety for basement occupants, especially during flooding events, is a priority for the City. One way the Department of City Planning is supporting this effort is through its release of the Building Elevation and Subgrade Data Set. This data set is the most comprehensive data yet available on the elevations of New York City buildings and the presence of subgrade space, such as a basement or cellar. Available on NYC Open Data, this geospatial data set will allow the City to fine-tune its assessment of flood risk from extreme weather events, improving emergency management warnings and allowing local organizations to better access funding for local climate resilience efforts based on the risks they face. However, this data does not provide information on what the subgrade space is used for.
Comment 4: Land Use Planning and Zoning: Can NYC DCP re-evaluate Strip Malls for repurposing in particular Strip Malls that have been abandoned. Or that are being underutilized and have become an eyesore to the community?
Response 4: Thank you for your comment. The City has worked previously with community stakeholders to repurpose underutilized shopping centers and is continuing to explore new opportunities to do so in the future. For example, the City’s 2018 Downtown Far Rockaway Plan sought to address decades of disinvestment, resulting in retail vacancies and a lack of community services, amenities, housing options, and quality open spaces in the area. The centerpiece of the plan was positioning the underutilized shopping center site at the heart of the downtown that is currently being redeveloped with mixed-income housing and commercial, community facility, and open space through zoning changes and other actions stemming from the 2018 plan.
Additionally, the City of Yes proposals for Economic Opportunity and Housing Opportunity work together to facilitate mixed-use development with mutually reinforcing commercial and residential uses. Housing Opportunity, in particular, seeks to enable “Town Center” developments in low-density commercial districts that would re-legalize 2 to 4 stories of apartments above a commercial ground floor. The proposal also provides additional flexibility for irregularly shaped lots and lots with existing buildings that will remove obstacles to reuse underutilized sites, like strip malls with significant vacancy issues that are or threaten to become eyesores to the community.
Comment 5: Polluted Water Bodies: Is more data available to identify the primary contaminants of concern in the waterways surrounding NYC? How do these vary between impaired and stressed regions?
Response 5: Thank you for your comment. As required by section 303(d) of the Clean Water Act, DEC must review which waterbodies are “impaired” or not meeting the water quality standards. Those waterbodies are included on the “303(d) list”. This list is updated every two years and approved by EPA. This data includes information on pollutants and their suspected sources. See link to DEC website https://dec.ny.gov/environmental-protection/water/water-quality/nys-section-303d-list-of-impaired-tmdl-waters.
Comment 6: Stormwater Management: “When normalized by land area, seven out of the top ten neighborhoods receiving green infrastructure investments are EJ Neighborhoods in Brooklyn and Queens.”: This is not the indicator that should be used to illustrate inequities in green infrastructure. Current maps of green infrastructure exist and should be used to illustrate disparities.
Response 6: Thank you for your comment. A large portion of green infrastructure assets are in EJ areas, though spatially, they are focused in Queens and Brooklyn in order to have the greatest reduction in combined sewer overflow (CSO). Investments in green infrastructure must be based on the ability to capture stormwater for CSO reduction or local flooding and not all areas of the city are conducive to GI. It is important to note that assets like parks, street trees, greenways, and blueways are not considered green infrastructure. Access to parks and natural resources is discussed in the report beginning on page 62. Based on this feedback, we have included additional language on page 136 to clarify what green infrastructure assets include.
Comment 7: CSO Long Term Control Plan: “…green infrastructure investments..” – what does this mean? The report does not spell out what projects are considered green infrastructure projects/investment are more detailed table would be useful
Response 7: Thank you for your comment. Within the context of stormwater management, the term green infrastructure includes a wide array of practices at multiple scales to manage and/or treat stormwater, maintain and restore natural hydrology (including restoration of historic stream beds and ravines associated with reconnecting previously existing stormwater hydrology) and ecological function by infiltration, evapotranspiration, capture and reuse of stormwater, filtration, and detention. Based on this feedback, we have included additional language on page 136 to clarify what green infrastructure assets include. Please see the Improving NYC Waterways Report that outlines strategies to reduce CSOs. https://www.nyc.gov/assets/dep/downloads/pdf/water/nyc-waterways/citywide-ltcp/improving-water-quality-by-reducing-the-impacts-of-csos-fall-2017.pdf
Comment 8: Extreme Rainfall: No mention of Cloudburst Resiliency and Planning Study? And this section could probably use some analysis on infrastructure issues and not just “low lying areas”
Response 8: Thank you for your comment. We have included the Cloudburst Management program under Funding and Resource Allocation in the Climate Change section and City Programs and Initiatives in the Appendix.
Comment 9: Lead in Housing Plumbing: What about Low Income Homeowners that have had their lead pipes replaced before this program was implemented? Can they be reimbursed?
Response 9: Thank you for your comment. DEP has partnered with American Water Resources (AWR) to offer a voluntary service line protection program, which can be used to cover the cost of a service line replacement in certain cases for enrolled property owners.
Link: https://www.nyc.gov/site/dep/pay-my-bills/service-line-protection-program.page
Comment 10: Polluted Water Bodies: Request for clarification on NYS DEC’s definition of Impaired versus stressed.
Response 10: Thank you for your comment. We have included definitions for stressed and impaired water bodies in the Exposure to Polluted Water section under Polluted Water Bodies. See link to DEC website https://dec.ny.gov/environmental-protection/water/water-quality/nys-section-303d-list-of-impaired-tmdl-waters
Comment 11: Polluted Water Bodies: So, are they saying that the Arthur Kill and Lower Newark Bay are Impaired? And that the Kill Van Kull from Mariners Harbor to Stapleton is stressed? Because people are using Fresh Kills creek and Saw Mill creek that run into the Arthur Kill for Kayaking too.
Response 11: Thank you for your comment. The Arthur Kill is impaired, and the Lower Newark Bay is stressed. The section of the Kill Van Kull that you referenced between Mariners Harbor and Stapleton was not included in the NY State Department of Environmental Conservation’s (DEC) assessment used to identify the recreation status for waterbodies. Fresh Kills Creek and Saw Mill Creek are not on DEC’s 303(d) List of Impaired Waterbodies. However, the tributaries you mentioned are on the 303(d) list. The State regularly revisits the appropriate uses for waterbodies, but people sometimes use waterbodies regardless of the State’s designation.
Comment 12: CSO Long Term Control Plan: “Within the same period, over $1.15 billion has been spent on green infrastructure projects such as curbside rain gardens, street-length bioswales, and park and playground infiltration practices. DEP has committed $3.5 billion (including investments already made) toward green infrastructure across the city.” – It appears that none of the $1.15 billion or $3.5 billion has made it to Staten Island’s North Shore, so it’s not exactly across the City in terms of distribution. New York City has 5 boroughs but this money and projects only went to 4.
Response 12: Thank you for your comment. In Staten Island, the City has made stormwater investments in Bluebelts, which are a series of best management practices (BMPs) which work with natural features to store, convey, and filter stormwater. To date there are 83 BMPs on Staten Island. DEP is currently evaluating two locations on the North Shore, in Cloves Lakes and Snug Harbor, to site additional bluebelts.
Comment 13: Potential Improvements to the NYS DAC Criteria: The first time we experienced Pluvial Flooding was with Hurricane Irene 2011. But no one paid us any attention and so therefore even though Upstate New York received assistance from the government, Staten Island’s North Shore was ignored so all of the damages that we sustained had to be argued through with the insurance companies or we paid for repairs out of pocket.
Response 13: Thank you for your comment. This City has highlighted pluvial flooding as a potential improvement to the New York State Disadvantaged Communities criteria. See page 48.
Comment 14: Polluted Water Bodies: No discussion of annual pesticide sparing by DOHMH and potential impacts on water quality.
Response 14: Thank you for your comment. The DOHMH conducts various environmental assessments periodically. The most recent and comprehensive review took place in 2017 and is available at https://www.nyc.gov/assets/doh/downloads/pdf/wnv/wnv-environmental-impact-statement-2017.pdf. Additionally, the Health Department implements extensive measures to safeguard water quality during mosquito control operations, including maintaining a 300-foot distance from environmentally sensitive water bodies, conducting pre- and post-spraying water tests through the Westchester Water Testing Lab, and monitoring aquatic life mortality with vigilant oversight from the Parks Department. Notably, over the last two decades of West Nile spraying in NYC, no significant pollution nor related adverse impacts on aquatic life have been detected.
Comment 15: Outdoor Air Pollution: Does not discuss the spatial distribution of DEC monitors (very sparse, large gaps between sensors). There is also no mention of the mobile air monitoring conducted by DEC over the last year.
Response 15: Thank you for your comment. Based on this feedback, clarifications have been added to the text on page 72.
Comment 16: Indoor Air Quality: No discussion of NYC DOHMH programs that respond to indoor air quality complaints, and potential data available to highlight disparities.
Response 16: Thank you for your comment. As we discuss in the indoor air quality section on page 89, the report’s analysis on indoor air quality was constrained due to data limitations. Data on indoor air quality is inherently difficult to collect as it would require access to residents’ homes. We did not include data on indoor air quality complaints as these do not directly measure air quality.
Comment 17: NYC Community Air Survey: “A comparison of PM2.5 readings taken at the survey’s environmental justice sites and estimates developed from data collected at routine sites showed that recorded values at the environmental justice sites were only 4 percent higher than the modeled estimates. This points to the model’s statistical accuracy amid calls for hyperlocal monitoring in EJ communities to better assess exposure to pollutants.”: This raises the question – how can the NYCCAS data actually be used for advocacy? How can it be used to identify specific sources of pollution that need to be remediated?
Response 17: Thank you for your comment. Based on these questions, clarifications have been added to the text on page 78.
Comment 18: Transit and Alternative Transportation Access: “Transit reliability and accessibility can vary between neighborhoods due to a myriad of factors and quantifying potential disparities is challenging.” – Then how are disparities being evaluated if not quantitative?
Response 18: Thank you for your comment. Succinctly quantifying disparities in transit reliability and accessibility is challenging. As mentioned in the report, measuring transit access to opportunity may be a more suitable method of assessing transit equity. The report utilizes the TransitCenter’s Transit Equity Dashboard for this purpose. Additionally, the Department of City Planning has developed a Transit Travelshed tool which measures access to jobs, the labor force, and population within a 60-minute commute on public transit in New York City.
Comment 19: Transit and Alternative Transportation Access: Interesting and does not reflect the typical narrative from advocates: “On average, residents in EJ Areas have greater proximity to subway stations and bus stops overall than residents in non-EJ Areas”
Response 19: Thank you for your comment.
Comment 20: NYC Clean Trucks Program: “Of the replacement trucks, 74 percent had new, lower-emission diesel engines, 14 percent had compressed natural gas (CNG) engines, 11 percent were hybrid electric vehicles, and 1 percent were battery electric vehicles.”: How are clean trucks defined? Looking at the numbers, 74% of new vehicles still have diesel engines, which continue to emit pollution.
Response 20: Thank you for your comment. Clean Trucks are defined as new trucks that are either all-electric or, at a minimum, compliant with the latest Environmental Protection Agency (EPA) emission standards. Retiring a 2009 or older diesel vehicle and replacing it with a 2010 or newer vehicle will result in a significant emissions reduction benefit based on the new standard. As vehicles are replaced with new vehicles, the Clean Trucks Program uses the EPA Diesel Emission Quantifier (DEQ) to determine the difference in emission reduction profiles of the older versus the newer vehicles, including diesel to diesel replacements. As more zero emission vehicles enter the market for purchase, the program expects these reductions to trend closer to 100% reduction in tailpipe pollution. An analysis of the current emission reductions of the vehicles replaced using the DEQ can be found at https://www.nycctp.com/program-success/.
Comment 21: NYC Clean Trucks Program: Why is Hunts Point excluded? No explanation is provided.
Response 21: Thank you for your comment. Hunts Point was excluded from the analysis of funding distribution in eligible IBZs because the neighborhood had an eight-year head start and an outsized level of funding compared to the other IBZs. Funding to non-domiciled trucks was also excluded from the analysis as there was no data on their locations, eliminating the possibility of any spatial analysis.
Comment 22: Transit and Alternative Transportation Access: Great to see micro-mobility included: “In this analysis, transportation includes public mass transit, like the subway and bus systems, and alternative transportation to support shorter trips, like bikes and e-scooters.”
Response 22: Thank you for your comment.
Comment 23: Access to Green Jobs and Technology: Relatively focused on training but does not say much about those who are trained and hiring practices in the “green jobs” space – it is great that we want to get people trained and develop skills but what happens afterward?
Response 23: Thank you for your comment. The City’s Green Economy Action Plan (GEAP) speaks to the engagement of workforce training throughout Chapter 4 which details direct actions people looking to access training or be involved in the green economy can take. The GEAP will be accompanied by a webpage that details an exhaustive list of options for New Yorkers looking to be involved with the green economy on everything from training to job placement.
Comment 24: Access to Green Jobs and Technology: Missing analysis: There is a lack of official, universally accepted certifications and industry standards on emerging energy efficiency technologies – as a result this creates additional barriers to finding jobs i.e those created by LL97 – many employers of these jobs are require advanced engineering degrees to do entry level work.
Response 24: Thank you for your comment.
Comment 25: Access to Green Jobs and Technology: Will considerations be taken for smaller EJ Grass Roots organizations that don’t have the resources or staffing to handle both Environmental Justice issues that occur daily and the desire of others that don’t have connection to the EJ communities for these Grass Roots organizations to handle Green Job placements too?
Response 25: Thank you for your comment. EDC encourages people and organizations from all communities and industry sectors to get involved in the green economy, whenever possible, and understands that grassroots organizations in EJ communities are often at capacity serving their communities in other ways.
Comment 26: Health-related Housing Maintenance Issues: Percent of renter households reporting 3+ maintenance deficiencies [table]. This data does not align with HPD violations data (2022).
Response 26: Thank you for your comment. The data used for the study is based on the 2017 Housing and Vacancy Survey (HVS). The HVS is the most authoritative source of information regarding the City’s housing stock because it includes responses from tenants who may have not reported maintenance deficiencies to the City, which would not appear in the public violations data.
Comment 27: Health-related Housing Maintenance Issues: “Homes with multiple maintenance issues such as mold, peeling paint, and inadequate heating during winter months can negatively impact health.”: Does not mention pests or leaky roofs.
Response 27: Thank you for your comment. The list of maintenance issues in the statement above is not fully inclusive of all maintenance issues regulated by the Housing and Maintenance Code (HMC). The HMC does regulate the presence of pests and holes in the roof, which are included in the data tracking the percentage of renter households reporting at least three maintenance deficiencies in their unit.
Comment 28: Polluted Water Bodies: There is no key to indicate what the red and blue areas of the map mean.
Response 28: Thank you for your comment. MOCEJ has included map keys in all final versions of the maps, including the NYC Stormwater Flood Maps.
Comment 29: Advancing Environmental Justice: ‘There is no consistent definition across City agencies for “disadvantaged communities.”’: The City should refer to the State definition of disadvantaged communities, with special consideration for adding missing communities.
Response 29: Thank for your comment. We are using the State’s DAC designation to define NYC’s EJ Areas in this report. These EJ Areas will be used consistently across City agencies. We agree that special consideration for missing communities is necessary, which is why we have outlined potential modifications to the DAC Criteria that would better reflect EJ communities in NYC in the “Potential Improvements to the Current Methodology” section of the Report.
Comment 30: Polluted Water Bodies: Key Findings: No discussion of barriers to accessing waterfront spaces, especially for EJ communities.
Response 30: Thank you for your comment. We conducted an analysis of access to parks and open spaces, which did include publicly accessible waterfronts. However, waterfront access was not specifically analyzed. Throughout the report, lack of waterfront access is identified as a concern for EJ communities. Additionally, the Department of City Planning’s NYC Comprehensive Waterfront Plan has studied access to waterfront open space. This study, which is included in the appendix, will help inform the development of the EJNYC Plan.
Comment 31: General Comment: This comment is meant to bring attention to something I consider vital to the importance of fostering fair treatment and meaningful involvement for all citizens in the development, implementation, and enforcement of environmental laws, regulations, and policies—a core principle of environmental justice. And a stated foundational focus of the information gathered in this report. In our pursuit of this goal, we have encountered foundational challenges in communication, leading to a lack of or inability to obtain adequate and proportionate feedback and engagement from citizens. This report aimed to comprehensively evaluate and connect with environmental justice communities; however, the existing communication channels highlighted a need to strengthen the City’s capacity to engage with its citizens. We recommend expanding communication channels beyond translation services. To effectively address the challenges faced by New Yorkers in the 21st century, particularly in terms of sheltering in place, communication, and community organization, it is imperative to establish a structured local, neighborhood system that promotes information and engagement. This includes the development of a robust feedback loop that facilitates a strategic enhancement of actionable knowledge on the effectiveness of financial development, and spending to squeeze the most out of every dollar spent on the achievement of these goals. To create this loop there must be a significant investment in communication and a build-out beyond the current level of available services. To effectively address the challenges faced by New Yorkers in the 21st century, particularly in terms of sheltering in place, communication, and community organization, it is imperative for the city to establish a structured local, neighborhood, communication system that promotes and engages with citizens by providing and receiving information from citizens differently. This necessitates a strategic enhancement to communication services beyond the current level of translation services. Without being able to gather proportional feedback, relative to population size or through classification, the city will lose the ability to effectively squeeze the most out of every dollar being spent to make improvements in resilience and mitigation of injustice that understands climate does not know justice. And this situation will have some effect on us all. So by reducing carbon emissions, transitioning to grid electrification, and ensuring resilience in the face of more frequent extreme climate events, more advanced methods of communication and advancement in its structure must be developed beyond conventional approaches in favor of more modern and innovative strategies. In conclusion, communication is a critical factor that will influence the cohesion of neighborhoods and boroughs under anticipated pressures. Additionally, budgetary considerations are paramount in achieving these goals. New York City must judiciously allocate resources and extract double or triple duty from its investments. This can only be accomplished through the implementation of an expanded communication structure that incorporates a feedback loop to assess the value derived from these plans and expenditures.
Response 32: Thank you for highlighting these concerns regarding communication and engagement between the City and EJ communities. The City is committed to improving overall communication and collaboration with local residents and community-based organizations. Per local law, the EJNYC Plan must identify potential city-wide initiatives related to encouraging greater public engagement with and participation in decision-making that raises environmental justice concerns. We hope to continue working with yourself and other key stakeholders on the development of this plan.
Comment 33: Utility Access and Affordability: “PUMA” is never defined in the documents – Public Use Microdata Areas
Response 33: Thank you for your comment, PUMAs are defined in the caption of the Utility Burdens Household map which is the first time PUMA appears in the report. Additionally, a definition of PUMAs is included in the abbreviations section of the appendix.
Comment 34: General Comment: This report should be reviewed and revised by a single editor to create a more cohesive voice across sections. Currently, the report is disjointed and has several sections that are written in a way that would not be accessible to the general public.
Response 34: Thank you for your comment. Due to the report’s large scope, there are a wide range of topics discussed throughout and report writing was adjusted based on what was most appropriate for a given topic. We worked to maintain a cohesive voice and tone throughout the report and mapping tool, while prioritizing accessible language as much as possible.
Comment 35: General Comment: For all figures in the document, they should have a caption that explains the figure in a way that the general public can understand. For the figures that have acronyms, the caption should also redefine the acronym so the reader does not need to refer back to the main text in order to understand the figure. Also, if the figure data is available somewhere, such as NYC’s open data portal, that should also be mentioned in the caption.
Response 35: Thank you for your comment. All charts and figures have been updated with acronyms spelled out. The sidebar content within the mapping tool provides easy to understand information on all maps and datasets. All datasets are available for download on the mapping tool.
Comment 36: Identifying EJ Areas: “The DAC criteria are similar but not identical to the Climate and Economic Justice Screening Tool (CEJST) criteria, developed by the White House Council on Environmental Quality, which identifies 52 percent of New York City census tracts, containing 57 percent of the city’s population, as disadvantaged communities.” In this statement, it is important to note that the CEJST is not the only other screening tool.
Response 36: Thank you for your comment. Based on this feedback, we have included a mention of other EJ screening tools on page 41.
Comment 37: Advancing Environmental Justice: In the section on Advancing Environmental Justice, it would be important for the public to know what the process is for implementation of EJ policy proposals that result from the EJNYC plan. It is important to discuss whether there is currently accountability, such that the recommendations will be acted on. If there currently is not formal accountability in place, are there any resolutions or additional local laws needed to make sure EJNYC policies are implemented?
Response 37: Thank you for your comment. EJ policies, including recommendations and initiatives, will be developed alongside key stakeholders as part of the EJNYC Plan. The EJNYC Plan’s development process will include engagement with key stakeholders and residents of EJ Areas. A public comment period will follow the release of a draft EJNYC Plan. As required by local law, the EJNYC Plan will include a description of any amendments to laws or rules that would facilitate implementation of any of the recommendations.
Comment 38: Extreme Heat: “Access to home air conditioning is the most effective way to prevent disease and death due to heat exposure.” – There is no mention of cooling centers or the advantages of trees/urban tree canopy/greenspace
Response 38: Thank you for your comment. On pages 65-66 we describe the inequitable distribution of the urban tree canopy, as well as the cooling benefits it provides. Based on this feedback, we have included a description of Cooling Centers in the appendix.
Comment 39: Exposure to Climate Change: Key Findings – there needs to be a key finding on extreme rainfall given then increased importance on this issue
Response 39: Thank you for your comment. One of the key findings presented in the Exposure to Climate Change Sections is “NYC’s EJ Areas population is disproportionately exposed to flooding due to coastal storm surge, chronic tidal flooding, and extreme rainfall in the current decade.”
Comment 40: Transit and Alternative Transportation Access: “Historically, over-policing and anti-fare evasion policies have disproportionately affected Black and Hispanic or Latino riders.” – Great addition! But did not thread the needle on how this (fare evasion arrests) further burdens on Black/Latino communities
Response 40: Thank you for your comment. Over-policing was not identified as an environmental justice concern in the public scoping process. Throughout the report we acknowledge the intersection of environmental justice and other social justice issues, including criminal justice.
Comment 41: Conclusion: How will this tool incorporate and/or replace the existing data portals/tools that exist at the city level? Who will be responsible for maintaining this tool over time?
Response 41: Thank you for your comment. The EJNYC Mapping Tool will consolidate data related to environmental justice concerns. It is meant to complement existing data tools and portals rather than replace any. MOCEJ will maintain the mapping tool over time.
Comment 42: Environmental Justice Today and Tomorrow: The statement “Climate change will further multiply the inequitable impacts from extreme heat and flooding in EJ areas” should be expanded, there is plenty of evidence that climate change is a vulnerability multiplier and will increase pre-existing vulnerabilities far beyond extreme heat and flooding, to include chronic stress, food insecurity, housing insecurity, forced displacement, etc.
Response 42: Thank you for your comment. This concept of climate change acting as a threat multiplier is discussed in greater detail in other sections of the report, including the “Interconnected EJ Issues” section and the “Exposure to Climate Change” section.
Comment 43: Potential Improvements to the NYS DAC Criteria: We get noise pollution from Newark Airport and we have to contact our Congressional and State Representatives to get the Newark Air Traffic Control to reroute the planes away from the North Shore EJ Communities. For the record and for the purposes of safety commercial airlines are supposed to fly over water and not residential communities. Staten Island’s proximity to New Jersey and the negative impacts from New Jersey’s airports, ports and industrial zones that affect Staten Island should not be dismissed simply because out of the 5 boroughs we are the only ones that are experiencing them. In terms of the shipping channels, the Kill Van Kull, Lower Newark Bay and the Arthur Kill every time the NY/NJ Port Authority wants to widen or deepen these channels the City and the State of New York have to sign off on the project, which often times they do regardless of the negative impacts to the Staten Island EJ community. There have been 3 Blasting and Dredging Projects in the Kill Van Kull and each has lasted for 7 years causing property damages to homes and businesses near the waterfront. They blast during the day and they dredge throughout the night 6 days a week.
Response 43: Thank you for your comment. We understand your concerns related to noise pollution. You have highlighted an important point and a challenge we have encountered many times throughout the development of this report which is that some EJ concerns are more difficult to study and address due to multi-jurisdictional challenges. At the time of developing this report, there was no available dataset for noise pollution to include in our analyses of EJ concerns.
Comment 44: Land Use Planning and Zoning: Good to see the mention of New York State Cumulative Impacts Law
Response 44: Thank you for your comment.
Comment 45: Utility Access and Affordability: “Internet is not included in standard energy burden calculations but is increasingly considered a standard utility.” – Not sure how much we personally message on this but nice to see it included
Response 45: Thank you for your comment.
Comment 46: Utility Access and Affordability: Great connection to extreme heat and a/c use
Response 46: Thank you for your comment.
Comment 47: Exposure to Climate Change: “Understanding the intersection of environmental justice issues and climate change is a necessary step toward building an equitable adaptation resilience strategy […] focus on extreme heat, extreme rainfall, coastal storm surge, and tidal flooding.”
Response 47: Thank you for your comment.
Comment 48: Exposure to Climate Change: EJ vs. Non-EJ Population by Heat Vulnerability Index Score – this is a great chart/visual!
Comment 48: Thank you for your comment.
Comment 49: Advancing Environmental Justice: The Participatory Budgets that were given to City Council Members for community projects are usually not enough to solve any of the real problems in the EJ Communities. So they were looked at as niceties but not as anything to be taken seriously.
Response 49: Thank you for your comment. We chose to highlight two participatory budgeting initiatives led by the City only as examples of equitable engagement. These successes can provide examples for future practices that advance environmental justice.
Comment 50: Environmental Justice Today and Tomorrow: The New York State Cumulative Impact Law, has it begun yet?
Response 50: Thank you for your comment. The Cumulative Impacts Law is set to go into effect on January 1st 2025.
Comment 51: NYC Clean Trucks Program: How will the Low Emission Zones be enforced?
Response 51: Thank you for your comment. The low-emissions freight zone was introduced in PlaNYC: Getting Sustainability Done as a pilot program that will be launched by 2027. Specifics have not yet been developed.
Comment 52: Advancing Environmental Justice: Acronyms should also be included in the glossary so that readers can easily find the definitions and not have to search through the text to find the meaning of an acronym.
Response 52: Thank you for your comment. We have included a comprehensive list of abbreviations in the appendix.
Comment 53: Redlining: The conclusion – “Lower wealth in communities of color negatively affects access to resources.” – is not really contextualized well and it is unclear how homeownership impacts EJ issues at the community level since it is framed as individual family wealth (“Home equity makes up nearly two-thirds of wealth for the median American family.”)
Response 53: Thank you for your comment. Based on this feedback we have revised the language on page 57.
Comment 54: Access to Safe and Healthy Housing: “Energy efficiency retrofits can improve ventilation and incorporate building envelope upgrades that reduce noise (in addition to their thermal insulative qualities).”: There is insufficient evidence to know how building envelope upgrades will impact concentrations of all pollutants indoors. Another stated focus of building improvements must be pollution reduction (i.e. gas stoves and boiler switch outs reduce NOx)
Response 54: Thank you for your comment. Based on this feedback we have revised the language on page 109 to more clearly communicate that improvements to indoor air quality would require ventilation upgrades, not just building envelope upgrades. More details are provided in the “indoor air quality” section of this report on page 87.
Comment 55: Access to Safe and Healthy Housing: “As more multi-family residential buildings undergo energy retrofits to keep up with regulations, it is important that landlords balance the need to recoup investments with the imperative to share cost savings with tenants.” This statement does not tell the whole story. As multi-family buildings undergo these upgrades, it is important that tenants are protected from cost-shifting leading to rent increases that further displaces low and middle-income residents.
Response 55: Thank you for your comment. Based on this feedback, we have revised the language on page 109.
Comment 56: Utility Access and Affordability: Does not mention the potential impact building electrification could have on utility affordability
Response 56: Thank you for your comment. The focus of this section was on research related to energy cost burden, and not on the potential utility affordability impacts of electrification which is unknown. As buildings electrify, heating systems may shift from building level to unit level controls. This shift must be carefully considered as to not increase energy cost burden on low- or middle-income residents. The City will publish guidelines on how utility bills should be allocated for electrified housing; and HPD’s publication of Electric Heating Policy also provides guidance on owner-tenant utility billing strategies. Additional information on these owner-tenant cost implications and considerations for electrification can be found on Pages 63-64 of PowerUpNYC https://climate.cityofnewyork.us/wp-content/uploads/2023/09/PowerUpNYC.pdf Additional context can be found in PowerUp NYC.
Comment 57: Utility Access and Affordability: Section completely misses the importance of investing in energy efficiency via state and utility funding for low-income households, and that we must use funding that utilities historically use to fix leaky pipes & invest in new fossil fuels, to instead be used for deep subsidies for low-income buildings to afford an energy transition. There needs to be a connection between energy insecurity, energy burden, and the bigger energy transition.
Response 58: Thank you for your comment. Recommendations like these were not the focus of this report. However, the City has appointed a Utility Consumer Advocate in compliance with LL80 of 2022 who will advocate for shifts in utility spending such as what is suggested here and provide guidance and transparent information to the public on this and other utility related topics. Additionally, the City continuously advocates for solutions that advance the City’s decarbonization commitments in utility proceedings.
Comment 59: Exposure to Climate Change: There is no mention of the urban heat island effect, which is an important factor to NYC and extreme heat – there needs to be more acknowledgement of the built environment
Response 59: Thank you for your comment. Based on this feedback we have included language describing the urban heat island effect on page 143.
Comment 60: Advancing Environmental Justice: List the timeframe, e.g., year(s), that these efforts were launched/conducted to illustrate how recent/updated these resources are.
Response 60: Thank you for your comment. Based on this feedback we have added timeframes for the equitable engagement efforts highlighted in this section.
Comment 61: Appendix: Are there data sources that are not referenced in the Spatial Analysis Methodology that would be included in the Environmental Justice Mapping Tool?
Response 61: Thank you for your comment. Yes, there are data sources included in the Mapping Tool that are not included in the Spatial Analysis Methodology. While there is a lot of overlap, the data sources listed in the Spatial Analysis Methodology only reference data sources utilized for the Report’s analysis.
Comment 62: Access to Resources: How many facilities, industrial businesses (M3 Zones) are going to be Grandfathered Uses under the NYS Cumulative Impact Laws? I.E Cement Plants, Auto body shops, Waste Transfer Stations, Dry Docks, Dredge Spoil Operations, Salvage Yards.
Response 62: Thank you for your comment. Implementation of the Cumulative Impacts Law is outside the scope of this report. The New York State Department of Environmental Conservation has yet to issue regulations or guidance interpreting the Cumulative Impacts Law.
Comment 63: Stationary Sources of Pollution: This section is underscored to draw attention to additional sources of pollution burdens disproportionately borne by Environmental Justice (EJ) communities. The current transitional measures inadequately address new strategies to mitigate and reduce this particular source of pollution, highlighting another urgent facet of EJ that demands immediate attention. It is imperative to address and alleviate these additional burdens, surpassing those previously established, that these populations endure during the transition.
It is unacceptable for these communities to bear an extra burden associated with environmental justice initiatives designed to rectify imbalances. Therefore, the implementation of mitigation strategies is essential to ensure a fair and equitable distribution of impacts and benefits among all environmental justice communities
and stakeholders.
Furthermore, it is crucial to avoid isolating the effects of cumulative exposures and the additional burden of pollutants. Recognizing the interconnected nature of these challenges is vital for crafting comprehensive and effective environmental justice strategies that also pay attention to the expected gain from making mitigation investments in the first place. As mitigation strategies in one area may compound the lack of results in another area, ultimately effecting the ultimate success in positive change achieved for the health of EJ communities.
Response 63: Thank you for your comment. Implementation of the Cumulative Impacts Law is outside the scope of this report. The New York State Department of Environmental Conservation has yet to issue regulations or guidance interpreting the Cumulative Impacts Law.
Comment 64: Outdoor Air Pollution: As previously mentioned, climate and environmental factors do not discriminate based on justice; however, their impacts can disproportionately affect certain areas in predictable ways. For example, while congestion pricing and new transit development aim to mitigate air pollution, the remedy may impose an additional burden on frontline communities already strained by frequent visits to adult ER departments and a high percentage of census tracts classified as environmental justice (EJ) areas.
To address this issue comprehensively, it may be prudent to establish a new evaluation category specifically focused on assessing the benefits of mitigation efforts. This category should explicitly outline the anticipated burdens on frontline communities, providing both qualitative and quantitative measures of the expected benefits over time. Furthermore, it is imperative to address and alleviate the additional burdens placed on these populations during the transition. It is unacceptable for these communities to bear an extra share of the burdens associated with environmental justice initiatives designed to address the injustice imbalances. Therefore, mitigation strategies must be implemented to ensure a fair and equitable distribution of the impacts and benefits among all environmental justice communities and stakeholders.
Response 64: Thank you for your comment. Your recommendations and concerns are very much in line with the scope of the Environmental Justice NYC Plan. While such recommendations were not the focus of this Report, they may be considered throughout the development of the EJNYC Plan. We hope to continue engaging with you and other stakeholders throughout the development of the plan in order to embed EJ concerns into City decision-making.
Comment 65: General Comment: The objectives of this report align not only with Environmental Justice (EJ) initiatives at both the state and federal levels but also recognize the potential for the EJ report to leverage emerging resources to benefit New York City’s EJ community. This impact can be achieved through enhanced environmental benefits, reduced burdens on EJ areas, and addressing disparities in communities that have experienced undue environmental burdens.
To achieve these goals, even in the face of impending budget cuts, no matter how minor, a linear approach won’t suffice. Instead, the approach necessitates a growth-oriented experiment. I propose a novel perspective in addressing these issues. One that focuses on six general areas applicable to public housing communities. The EJ community of which I am a lifelong member of is NYCHA, the New York City Housing Authority. And as such it is a citywide EJ community, disproportionately represented within its a citywide footprint. The examples I will present are relevant to all EJ communities citywide, albeit any location specific community considerations.
1. Composting: Integrated pest management, waste reduction, and improved management.
2. Food Insecurity: Locally grown produce available in EJ communities, produced by the community member.
3. Social Cohesion: Enhanced, voluntary, civic cooperation directed by and by EJ communities.
4. Enhanced Workforce Development: Generation of new green industry pipelines beginning along with the expansion of programs like NYCHA section 3 to support an expanded new employment pipeline and a larger opportunity for work with NYCHA green contractors, increasing both indoor and outdoor work opportunities within NYCHA’s Resident Economic Empowerment and Sustainability service department.
5. Communication: Build out to function in support of these all activities and facilitate agency for EJ communities that can possibly function more independently as the system is built out.
6. Resiliency: First, a reasonable ability to shelter in place with agency and reliable systems for support.
Second, another long term focus and ultimate goal of the activities enacted in concert should be focused on their potential to expand the tax base of EJ communities and as a result the city of New York. Something which will contribute greatly to the future stability of the city as a whole along with environmental sustainability, as the ultimate measure of value and ultimate goal for success.
To incorporate these goals dynamically, the city must start measuring the long-term, monetary, and invaluable future benefits of maintaining order in the face of extreme climate, and extreme environmental events. It’s crucial to prepare for and mitigate the impact of these events seamlessly, aligning with the city’s environmental goals. Environmental justice stakeholders must have agency over systems related to the listed topics to become integral to the city’s fabric. And improved, updated green employment skills will result in higher wages and more contribution to the tax base.
I propose the city achieve this through the development of a pipeline like the one described above, with measurable benefits for the city, aligning with state, and current federal government initiatives. NYC can leverage this green development more innovatively. With designated focus not just in the energy sector, but also in the domestic sector. A sector sorely in need of the upgrade sustainable green development would provide. Momentum to enhance the cost-effectiveness and overall value, all of these efforts emphasize a focus on a layered approach to a dynamic implementation.
Taking NYCHA as an example, I envision NYCHA campuses becoming resilience hubs. Not only for themselves, but also for their surrounding EJ and non-EJ communities along with the NYCHA tenants. Because much of the EJ community may be forced to shelter in place, as during the COVID crisis, this effort must involve and be based in the tenant community through expanded training for the jobs that are required to maintain fully developed green community initiatives that are implemented. For example, citywide composting on cooperating NYCHA campuses can integrate integrated pest management and reduce methane release from food waste in landfills. among other things. Urban farming can address food insecurity, fostering social cohesion and resilience. All of this can be designed dynamically to generate economic activity in the green sector that contributes revenue to the city and to the EJ community it seeks to develop, green, and improve.
Around these hubs, access to computers for education and training can help bridge the tech divide, supporting the workforce development pipeline initiatives. Professional titles requiring certification such as, master composter, urban farmer, and repair association coupled with the management and facilitation of community engagement and educational support of these activities in these spaces can help propel EJ communities securely into the 21st century. These activities can engage multiple generations, fostering independence within EJ communities, and social cohesion with neighboring communities.
This also an opportunity for investment from technology platforms to also play a role in the city’s development of this pipeline. This will allow EJ communities to be connected integrally to the overall health of the city as a whole. Like an even stronger heartbeat, contributing to the improved greening, expanded growth, and improved health of the entire city. Making EJ communities more resilient, and ultimately better prepared. Both with the creation of a new workforce development training and civil service title pipeline of green professions, built around economic development opportunities, the city will be incorporating needed growth, both in and from the dynamic development of projects like these described in almost any EJ community. All the built in support for these green professional opportunities also enhances the overall benefit to climate mitigation, environmental sustainability, and beneficial to overall increased activity in the environmental, economic sector. A win-win for all of New York City.
Budgets fluctuate universally, but the goal here is to shift the paradigm of lack. As the city aims for lower emissions, improved health, and solid foundations, the approach is to turn a 5% budget cut across the board into an opportunity for creative and innovative growth that nets needed sustainable growth and development.
Coordinated, organized change is crucial to avoid setbacks in achieving parity and addressing disparities. Incorporation of and reliance on a cost-benefit analysis of EJ initiatives will provide a systematic method for evaluation of total costs against the evaluation of the total expected rewards. Fostering creativity within operations in a way that primes activity to gain optimal rewards from investments made in green development in EJ communities. This is a win-win for New York City.
Response 65: Thank you for your comment. We appreciate your thoughtful recommendations on policy initiatives and area for further exploration. While recommendations were not the focus of this report, we aim to address many of the topics you have raised through the development of the Environmental Justice NYC (EJNYC) Plan. NYCHA residents are critical stakeholders for the City’s work on environmental justice, and we hope to continue engaging with yourself and other NYCHA residents throughout the development of the EJNYC Plan.
Comment 66: Public Housing: This section is generally lacking, there needs to be a much deeper dive into data for lead-based paint, mold, heat, elevators, inspections, pests, and waste management in NYCHA.
Response 66: Thank you for your comment. For more information on the housing quality metrics you have highlighted, see below for the latest trends in the HUD Agreement Metrics:
• Heat – Heat outage figures are reported for the heating season, which began on October 1, 2023, and will end on May 31, 2024. The average time to resolve heat outages was reduced by 44 percent from 7.6 hours as of October 2022 to 4.3 hours in October 2023 and was under the target of 12 hours required in the January 2019 agreement with HUD.
• Elevators – The average time to resolve elevator outages was faster by 25 percent from 10.6 hours in the first four months of Fiscal 2023 to 7.9 hours for the same period in Fiscal 2024 and was below the target of 10 hours. The average outage per elevator per month also decreased from 1.03 outage per elevator per in the first four months of Fiscal 2023 to 0.91 during the same period in Fiscal 2024. The elevator service uptime exceeded the target of 97 percent. Efforts to improve elevator service included the backfilling of vacancies, and the hiring and training of additional elevator mechanic teams.
• Pests – NYCHA is making significant strides in pest management but is still working towards meeting the targets laid out in the HUD Agreement. The percent of rat complaints responded to within 2 business days increased 14 percentage points from 43.4 percent in the first four months of Fiscal 2023 to 57.4 percent during the same period in Fiscal 2024. The percent of rat complaints responded to within 5 days increased from 54.6 percent to 68.6 percent. In the first four months of Fiscal 2024, NYCHA significantly reduced the response time for rats to an average of 2.7 days compared to 9.2 days in the period last year. The performance for other pest complaints also improved. The percent of other pest complaints responded to within seven days rose from 16.5 percent in the first four months of Fiscal 2023 to 24.2 percent for the same period in Fiscal 2024. The percent of other pest complaints responded to within 10 days also increased from 22.4 percent in the first four months of Fiscal 2023 to 41.1 percent in Fiscal 2024. In the first four months of Fiscal 2024, NYCHA responded to other pest complaints within an average of 11.9 days compared to 53.5 days the period last year. NYCHA also saw a decline in resident complaints. In calendar year 2023 through October, the rat complaints decreased by 19 percent from 3,284 to 2,649 for the same time last year. The number of other pest complaints was also reduced by 10 percent from 30,490 in calendar year 2022 to 27,187 in 2023.
• Mold – In Fiscal 2024, NYCHA continues to improve its performance in addressing the root causes of mold. The percent of simple mold repairs completed within 7 days increased 10 percentage points from 24.8 percent in the first four months of Fiscal 2023 to 34.8 percent during the same period in Fiscal 2024. The percent of complex mold repairs completed within 15 days increased from 3.4 percent as of the first four months of Fiscal 2023 to 5 percent in Fiscal 2024. The percent of mold removed within 5 business days also improved from 6.2 percent to 9.7 percent. NYCHA has met the target of preventing mold recurrence after remediation and repairs. The proportion of mold cases that did not result in a recurrence was 85 percent in the first four months of Fiscal 2024, which was slightly lower than last year but met the 85 percent HUD target. From July 2023 to Oct. 2023, NYCHA reduced its inspection response time to resident mold complaints by 1.5 days (from 5.2 to 3.7 days) and NYCHA reduced its plumbing and tub enclosure work orders over 250 days by 26% or 2,536. Addressing these work orders will help decrease the moisture and leak issues and ultimately improve the completion time for simple and complex mold repairs.
• Lead – On December 1, 2021, New York City enacted a new law which lowered the threshold of lead in paint from 1.0 mg/ cm2 to 0.5 mg/cm2 for remediation. NYCHA has been abating units to comply with the new regulation and ramped up capacity since Fiscal 2023. The total number of units abated for lead increased significantly by 187 percent, from 616 units in the first four months of Fiscal 2023 to 1,766 units during the same period in Fiscal 2024. NYCHA’s Lead Hazard Control Department (LHCD) brought on a Project Management Office (PMO), LiRo, to oversee lead abatements and ultimately, temporary resident relocations needed to facilitate the abatements. The apartment abatement program is active at 76 developments and is expanding.
Comment 67: Public Housing: What are the numbers/trends/deltas?
Response 67: Thank you for your comment, the above response is intended to address this question.
Comment 68: Public Housing: Discussion is missing on the disparities within NYCHA
Response 68: Thank you for your comment. NYCHA’s most recent Physical Needs Assessment gives an overview of the different needs of various developments across NYCHA’s portfolio. https://www.nyc.gov/assets/nycha/downloads/pdf/2023-PNA-Report-Physical-Needs-Assessment-NYCHA.pdf.
Comment 69: Public Housing: Discussion on PACT/Trust is missing and how/if these programs will address environmental health hazards
Response 69: Thank you for your comment. Renovations of NYCHA buildings performed through the PACT program and the Public Housing Preservation Trust are opportunities to improve housing quality and are required to address core environmental health concerns such as lead and mold. Additionally, these renovations strive to bring residents major improvements in energy efficiency, comfort, and satisfaction with their homes.
Comment 70: Public Housing: Highlight the sustainability pilot projects NYCHA is working on (solar, heat pumps, waste management systems etc.)
Response 70: Thank you for your comment. Based on this feedback we have included additional NYCHA initiatives in the City Programs and Initiatives section of the Appendix.
Comment 71: NYCHA Customer Contact: The concerns regarding the Comprehensive Community Care (CCC) system revolve around its failure to effectively address repair needs and backlogs, despite its initial purpose. The circular communication with management, especially in the case of emergency repairs, leads to a lack of timely service for tenants. The inability to contact the CCC for follow-ups or complaints about service levels poses a significant challenge. Instances involving water leaks, flooding, gas, and electrical repairs further exacerbate the situation, necessitating calls to the fire department for urgent assistance, as CCC workers lack information on repair logistics and tenant safety. Moreover, the absence of oversight and communication between the CCC and the Quality Assurance (QA) department contributes to a disjointed approach to addressing tenant issues.
The identified issues underscore the pressing need for NYCHA to establish a robust communication system that goes beyond the current appointment-based model. This proposed system should facilitate monitored feedback from stakeholders, allowing for a comprehensive evaluation of budgeting, fiscal management, and strategic efforts to address past issues. Furthermore, skepticism arises from a reported statistic on Emergency Work Orders completion within 24 hours, prompting questions about tenant surveys, follow-up methodologies, and the absence of tenant feedback in the reported statistics. These concerns emphasize the necessity for a transparent and realistic representation of CCC operations, acknowledging the experiences of tenants and aligning statistical reporting with the realities observed by community members. In summary, the proposed edits seek to rectify communication inefficiencies, enhance oversight, and address the genuine concerns of tenants within the CCC system, thereby ensuring a more effective and transparent process.
The following list highlights suggested improvements for NYCHA to better utilize the work of the CCC for both construction, development, maintenance, and close fiscal oversight that ensures the most efficient expenditure of funds NYCHA requires for repairs, updates, and tenant involvement in such matters.
Following List of suggestions for improvement
- Clearly state the purpose of the CCC and its role in addressing tenant concerns.
- Clearly state the purpose of the emergency repair process and its follow-up capabilities.
- Streamline the explanation of the circular communication issue with management for emergency repairs.
- Specify the designated response times for emergency repairs by NYCHA in real time.
- Clarify the limitations faced by tenants who are unable to receive timely service.
- Be clear what the cost to missed appointments and follow-up really involve for tenants. (i.e. timeloss, damages, etc).
- Develop more robust communication channels.
- Emphasize the purpose of the CCC in providing an alternative channel for tenant complaints and real-time estimates.
- For matters of issue resolution, again, highlight through effectiveness the primary problem the CCC was designed to address, namely the lack of oversight. Include a tenant interactive connection to the NYCHA QA department.
- Provide specific examples of any statistics reported and cross check against departments.
- Reference the chart on page 110 related to Emergency Work Orders completed within 24 hours.
- Question the reporting accuracy and suggest the need for transparency.
- Inquire about tenant feedback and the methodology employed, such as random surveys and follow-up reviews.
This will require the development of modern, robust forms of communication channels to effectively convey the significance of environmental justice, its connection to climate issues, and its crucial role in addressing global environmental challenges. This includes ensuring universal access to broadband and establishing a solid foundational communication system. Implementing an open feedback loop is essential to increase public input and enhance understanding of the challenges and the implications of addressing them for the City and its citizens.
Drawing from my lifelong experience as a NYCHA tenant and a proud lifelong New Yorker, I highlight the challenges faced by Tenant Associations in effectively addressing the 1440 apartments in the development. The current monthly meeting schedule, held at 6 pm on the last Thursday of the month, poses barriers for many tenants, leaving word of mouth as the only means to access discussed information. Tenant association leaders are holding regular jobs, have families, and are committed to their communities. There should be made available required training in community engagement and access to a comprehensive structure supporting community involvement. They should have adequate resources for committee training, access to a listserv for publishing meeting minutes, and a phone or internet setup for voting to increase interaction and feedback.
Tenants should be able to vote and respond to NYCHA initiatives before borough-wide meetings. As it stands currently the tenant association president is besieged with requests to focus on outstanding repairs, negotiated with management to be addressed. The focus on outstanding repairs during these meetings places an undue burden on the Tenant Association. Outstanding repairs are NYCHA’s responsibility. And the duty of addressing this takes away from efforts to enhance sustainability and improve upon the environment outside of the buildings and not just in the apartments, interfering with full agency in the place of residence. Because as we all know everything in the environment is connected. So it’s not just about what happens inside your apartment, but outside your apartment and in your community as well. And all the moving parts would benefit from a conversation with one another.
Tenant leaders across the city should be supported in tenant organizing. Not just for NYCHA tenants and not just for communications that facilitate NYCHA repairs. The benefits of running a tenant organization should focus on skill development enhancing employment and professional abilities. The city can learn from these challenges to address the substantial portion of the overall Environmental Justice (EJ) community facing difficulties in accessing modernized communication methods. Despite owning cell phones, EJ community members lack access to desktops, laptops, or tablets, highlighting the need for comprehensive broadband and wifi access. For example, in my NYCHA development, outdated communication practices hinder tenant participation, extending these challenges to broader barriers in public engagement processes. Expanding my example to encompass all EJ communities, these challenges need to be addressed across all EJ communities. It is crucial to establish additional levels of communication, separate from traditional channels, for effective engagement in emergencies related to climate or environmental concerns. There needs to be established different methods for the collection of feedback, meaningful and otherwise. Citizens need meeting spaces to organize their communities around their concerns in preparation and response to unpredictable climate and environmental crises. This necessitates the building of structures facilitating neighborhood-wide communications, organized by ordinary citizens with ambitious plans, and not necessarily involving an election, or activities that address EJ and climate that only require minimal interaction with formal political structures. New Yorkers’ ability to develop agency is vital in preparation for future challenges. The COVID crisis underscored the impact on disadvantaged populations, emphasizing the urgency of prioritizing effective communication in advance for New York City to thrive under such conditions. Collaboration, resource allocation, and stability measures are pivotal, and contingent upon a well-developed communication apparatus. All of this will be key to the continued development of a thriving city in the face of the current challenges described in this report. At this point what I’ve proposed also falls under the realm of public engagement that is not legally required. Yet, I bring this up this point to alert to the fact that this report was developed to address EJ and the effected communities. Where a high level of proportionate public engagement was not legally required, but necessary to secure input adequate to address the true magnitude of the issues communication represents. Express the expectation for improved transparency and a more realistic representation of statistics. Attention to these matters is crucial for ensuring the effectiveness and transparency of the CCC system, improvement in the overall performance of NYCHA, and improved tenant relations.
Response 72: Thank you for your comment. Operations is ultimately the NYCHA department responsible for responding to work orders generated by the Customer Contact Center (CCC). The CCC provides support to Operations by:
• Creating follow-up tickets and contacting the development
• Referring escalations to the particular development/borough office in question via a telephone call or emails
• Calling or emailing development management about missed appointments
Quality is monitored in five ways in the CCC:
• Customer Information Representatives are monitored at least 10 times each month and given feedback. Monitoring includes evaluation of recorded calls to ensure compliance with NYCHA standards and screen shots associated with each call to ensure efficient handling of the call.
• Call Center – The Quality Assurance Survey is designed to measure the quality of services provided by both the CCC call takers and the various development maintenance workers and skilled trades staff members. The Quality Assurance Survey is an automated process whereby the system randomly selects closed work orders, makes telephone calls to the residents and documents their responses to several questions asked. The CCC tracks the survey responses that are directly tied to the call center and reports on the overall satisfaction with the call center on a monthly basis.
• The Operations – Mold and Mildew Follow-up Survey is conducted to identify if mold or mildew has reoccurred.
• Customer Service Surveys are distributed on four dates during the month for the Walk-In Centers to gain additional feedback and insight into our customer service levels. Findings are shared with the staff.
• The Customer Service Side by Side quality review program is based on a random “inconspicuous observation” assessment of a customer service interaction at the Walk-In Center window.
Comment 73: Exposure to Hazardous Materials: This section as a whole lacks any data on health impacts of exposure to hazardous materials.
Response 73: Thank you for your comment. Characterization and surveillance of both exposure to hazardous materials and any possibly related health impacts is limited by available knowledge, regulation and data. Possible exposure to a hazardous material and whether that exposure will result in any adverse health outcomes is dependent upon the situation, the specific material, the location and characteristics of those exposed. In addition, it is very difficult – particularly for low-level, chronic exposures – to tie particular health outcomes to exposure to most common compounds. Moreover, being near a given hazardous substance does not mean an individual was exposed or that an exposure will result in an adverse health effect. Through Local Law 26 of 1988, the New York City Department of Environmental Protection regulates and enforces the storage, use, and handling of hazardous substances that pose a threat to public health and the environment. Any potential exposures stemming from DEP-regulated facilities receive emergency response, but unreported and unregulated hazardous substances remain a risk. Unfortunately, in the majority of cases, it is not possible to link specific, reported diseases or conditions with causative exposure to hazardous materials.
Comment 74: Contaminated Land: Is this map only showing current EPA Superfund Sites that are pending remediation? Or is it meant to show all U.S. EPA Superfund Sites, even those that have been remediated such as the Jewett White Lead Company site in Port Richmond, Staten Island?
Response 74: Thank you for your comment. This map only shows the EPA Superfund Sites that are on the National Priority List. It does not include all Superfund Sites, which are managed by several different federal agencies.
Comment 75: Exposure to Hazardous Materials: Also will the report include FUSRAP Sites, Formerly Utilized Sites Remedial Action Program for radiological contamination resulting from the Nation’s Atomic Energy Program? The Archer Daniels Midland Company site on Richmond Terrace, Staten Island is one such site and is scheduled to undergo remediation the mid-part of October 2023, and the remediation will be completed at the end of December 2023.
Response 75: Thank you for your comment, and for bringing attention to the Staten Island Warehouse FUSRAP site. The research on contaminated land conducted on behalf of this report is not exhaustive and does not represent all potential hazards or remediation sites in NYC. The limitations of this analysis are discussed within the Contaminated Land section on page 100 of this report. A comprehensive database of all federal remedial sites, including those under the FUSRAP Program, does not exist. While this particular site was not discussed, the report does acknowledge that many neighborhoods with greater concentrations of cleanup sites are waterfront EJ communities near heavy industrial areas like Port Richmond, where this FUSRAP site is located.
Comment 76: Environmental Remediation: The Community Brownfield Planning Grants that LDCs have gotten, have yet to have proven to be beneficial to the EJ communities on Staten Island as the types of businesses they have aligned with have shown little interest in maintaining the current residents and are more interested in gentrification.
Response 76: Thank you for your comment. These Community Brownfield Planning Grants are available to CBOs all over New York City. The Mayor’s Office of Environmental Remediation (MOER) publicizes them to hundreds of groups via its email list and social media channels and promotes them at conferences, workshops, and meetings. They have been used for projects ranging from area-wide studies to site-specific environmental investigations. Each grant requires a community meeting open to the public, where the grantee gets feedback and responds to questions. Each grant also requires a report that highlights the purpose and community benefit of the project. They are available on MOER’s EPIC Community page: https://a002-epic.nyc.gov/community/home
Comment 77: Capital Planning: This section just outlines the process and draws no conclusion on how capital planning has impacted EJ communities (positively or negatively) over time.
Response 77: Thank you for your comment. Currently, there is no comprehensive outlook on how the capital planning and funding process has impacted EJ communities over time. This section serves to explain what the City’s capital process is and outline what the process is like year to year.
Comment 78: Cool Neighborhoods NYC: “Notably, there was no temperature monitoring in Staten Island.” Why wasn’t Staten Island’s North Shore monitored?
Response 78: Thank you for your comment. Neighborhoods were selected based on the Heat Vulnerability Index (HVI) and the planned planting schedule for Cool Neighborhoods as outlined in the Cool Neighborhoods Report (2017). The HVI map included in the report does not display any high heat vulnerable neighborhoods in Staten Island. In subsequent years with more refined data, heat vulnerability risk at a scale smaller than neighborhood community district was calculated. Additional temperature measurements on street trees were collected after the Cool Neighborhoods initiative in collaboration with DSNY near the Port Richmond wastewater treatment plant, and data are available upon request ([email protected]).
Comment 79: Advancing Environmental Justice: In the section about Opportunities, climate change mitigation and adaptation co-benefits should be discussed. Specifically, language should be added to discuss how climate mitigation and adaptation efforts, including federal funding from IRA and Justice40 benefits, provide the opportunity for addressing both climate change and EJ issues. Some of this is mentioned on page 133, but it should also be reiterated in the benefits sections. The current funding landscape is offering unprecedented opportunity for addressing EJ issues.
Response 79: Thank you for your comment. The topics discussed in this section were the result of facilitated discussions with EJ Advisory Board Members and EJ Study Contributors. The purpose of these discussions was to identify opportunities and challenges with existing processes and policies related to environmental decision-making. Leveraging federal funding opportunities did not come up in these discussions. However, we do recognize the significance of the current funding landscape in the Funding and Resource Allocation sub-section on page 155 of the report.