The public scoping process for this report identified specific EJ concerns for assessment. This chapter describes these EJ concerns and analyzes the associated data to establish a baseline understanding of the current state of environmental justice in New York City, by determining the distribution of environmental benefits and burdens across New York City and, where possible, identifying neighborhoods where disparities and disproportionate vulnerabilities may exist.
By analyzing EJ issues in this way, this report serves to establish a common understanding of the current state of environmental justice in New York City among City officials, residents, and advocacy groups, setting the stage for solution development during the EJNYC Plan process. This report also seeks to help New York City residents at large to better understand the cumulative and often intersecting issues that their communities face.
Identifying EJ Areas
The criteria for identifying EJ Areas provided in Local Law 64 of 2017 relied on only two demographic characteristics (income and race). However, in anticipation of the State’s legislative framework that was then under consideration, the law provided for the possibility of using New York State Department of Environmental Conservation (NYS DEC)’s parameters for the identification of potential EJ areas. To align with the State, therefore, this report identifies EJ Areas using the State’s Disadvantaged Communities (DAC) designation, which includes income and race and other parameters that are relevant to identifying communities that are burdened by environmental inequities.
New York State developed the DAC criteria pursuant to the Climate Act’s requirement that state agencies, authorities, and entities direct a minimum of 35 percent with a goal of 40 percent of the overall benefits of clean energy and energy efficiency programs, projects, or investments in the areas of housing, workforce development, pollution reduction, low-income energy assistance, energy, transportation, and economic development to 109Investments and Benefits Reporting Guidance. (n.d.). NYS Government. the Climate Justice Working Group, comprised of representatives from State agencies and EJ organizations from New York City and across the state, to work with subject matter experts to create and publish a methodology for identifying DACs. This methodology was developed over a multi-year process that included a public engagement and comment process with substantial community engagement and peer review. The DAC criteria ultimately consist of 45 indicators that describe various socio-demographic and environmental conditions across New York State’s census tracts. Based on this methodology, 44 percent of New York City census tracts, containing 49 percent of the city’s population, are designated as DACs. Residents of NYC’s DAC census tracts are predominantly Hispanic or Latino (43 percent, compared to 29 percent citywide) and Black (27 percent, compared to 21 percent citywide).110For the purposes of the analysis in this report, New York City’s population is categorized into five racial and ethnic categories: disadvantaged communities. The State convened Hispanic or Latino people of any race, non-Hispanic or Latino people in Asian/Pacific Islander, Black, White, or “other” racial groups. Additionally, 24 percent of residents in these areas are living below the federal poverty level, compared to 17 percent of residents citywide.
Demographics of EJ Areas
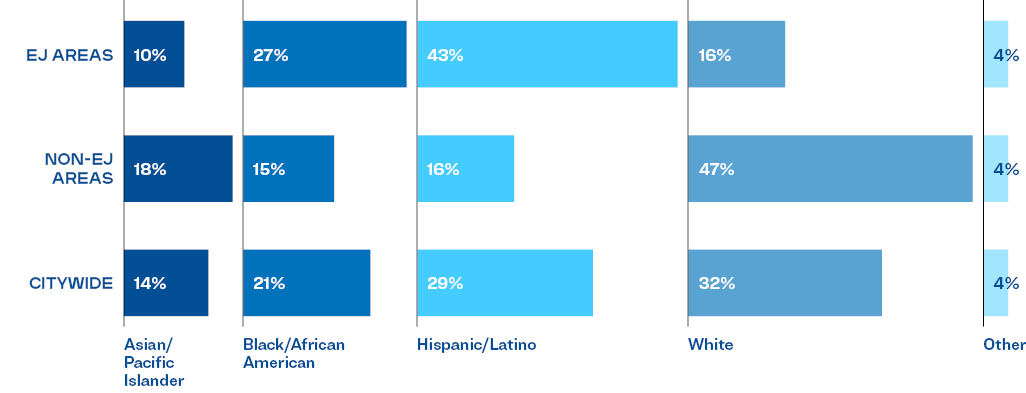
SOURCE: NYS Department of Environmental Conservation, Disadvantaged Communities Criteria, 2023. American Community Survey, 2017-2021 5-Year Estimates.
The DAC criteria are similar but not identical to the Climate and Economic Justice Screening Tool (CEJST) criteria, developed by the White House Council on Environmental Quality, which identifies 52 percent of New York City census tracts, containing 57 percent of the city’s population, as disadvantaged communities. The DAC criteria use a ranking system to adjust for NYC’s much higher rates of burden and vulnerability relative to the rest of the state, whereas the federal criteria rely solely on thresholds to determine whether a census tract is disadvantaged or not. Both the State and federal designations are expected to be used to direct public funding to disadvantaged communities. For example, State-designated DACs are slated to receive at least 35 percent of the benefits of spending on clean energy and energy efficiency programs, projects, or investments in the areas of housing, workforce development, pollution reduction, low-income energy assistance, energy, transportation, and economic development. It should be noted that there are other screening tools related to environmental justice concerns, such as the EPA’s EJ Screen and the CDC’s Environmental Justice Index.110Energy & Climate Equity Strategy. (n.d.). NYSERDA. NYS Government.
Organization of EJ Issues
The environmental justice issues studied in this report are organized in sections by topic area (such as access to resources and exposure to polluted air). Each section focuses on EJ issues and indicators related to the topic area, which were determined through the report scoping process and amended to respond to findings from the research and stakeholder engagement conducted for this report. The issues and indicators included in this report are not exhaustive but highlight major issues impacting quality of life, health, and well-being for those living in New York City’s EJ communities.
Each section contains a description and critical context for each EJ issue and a summary of the section’s key findings, supported by data analysis of the distribution of EJ benefits and burdens (between EJ Areas and non-EJ Areas, where possible), and a discussion of data gaps where applicable. The following sections also feature community case studies, program and policy spotlights of related City programs and investments that either advance EJ or exacerbate EJ concerns, and stakeholder quotes that contextualize these analyses in New Yorkers’ lived experiences.
Poverty Status of EJ Areas
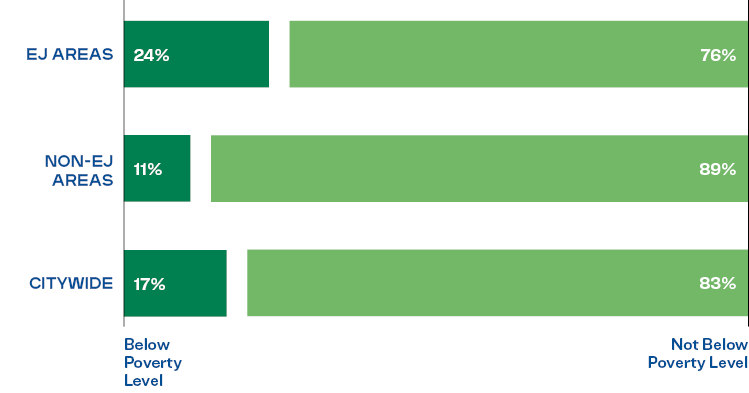
SOURCE: NYS Department of Environmental Conservation, Disadvantaged Communities Criteria, 2023. American Community Survey, 2017-2021 5-Year Estimates.
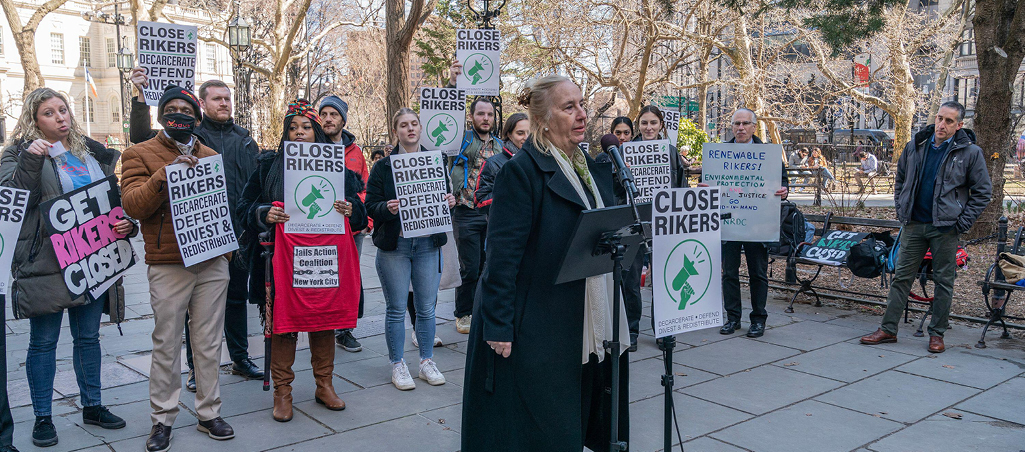
Elected officials and advocates hold rallies to urge Mayor Eric Adams to close Rikers Island prison by 2027 at City Hall Park.
Incarceration and Environmental Justice
This report would be incomplete without acknowledging the residents living within City jails. New York City continues to reckon with its legacy of discriminatory policing and sentencing practices that disproportionately targeted people of color and neighborhoods with a history of disinvestment.
A New York Civil Liberties Union (NYCLU) analysis of New York Police Department (NYPD) traffic data from an 18-month period, January 2022 to June 2023, revealed that Black and Hispanic or Latino New Yorkers are disproportionately stopped, accounting for 32 percent and 29 percent of traffic stops, respectively, while they each represent approximately 22 percent of the driving population.111NYPD Traffic Stops Data. (2023). NYCLU. Nonprofit Organization.Meanwhile, white New Yorkers are underrepresented in traffic stops, accounting for 25 percent of traffic stops, yet making up 40 percent of the driving population. Nearly 90 percent of people arrested during a traffic stop were Black or Hispanic/Latino.112NYPD Traffic Stops Data. (2023). NYCLU. Nonprofit Organization.This targeting of communities of color by the criminal justice system has adverse economic and health outcomes for the affected individuals, their families, and neighborhoods.113Structural racism and health inequities in the USA: evidence and interventions (2017). Bailey, Z., Krieger, N., Agenor, M., Graves, J., Linos, N., and Bassett, M. America: Equity and Equality in Health, 3. Academic Research.
People of color are disproportionately incarcerated nationwide, particularly Black men and boys. According to demographic reporting from the NYC Department of Corrections (DOC), 58 percent of people held in NYC jails in 2022 were Black, 31 percent Hispanic or Latino, 5 percent White, 4 percent other, and 2 percent Asian.114Population Demographics Reports (2022). NYC Department of Corrections. NYC GovernmentThe overall jail population is over 93 percent male.115Ibid.
In 2022, 19 individuals died in the custody of the NYC Department of Corrections, with the majority of those deaths taking place on Rikers Island.116Third Report and Recommendations on 2022 Deaths in New York City Department of Correction Custody. (2023). NYC Board of Correction. NYC Government.On Rikers Island in particular, staff shortages cause challenges in timely delivery of basic needs such as food and medical care and overcrowding and sanitation issues pose threats to human health.117Tracking the Deaths in New York City’s Jail System in 2022 (2022). The New York Times. News Article.In addition to these immediate operational concerns, Rikers Island faces multiple, compounding EJ issues. The jail complex is located less than 300 feet from LaGuardia Airport’s runways, exposing residents and staff to jet fuel emissions and disruptive noise. Furthermore, its facilities are built on the site of a former landfill, with past reports suggesting the likely presence of methane emissions and coal ash discards.118A Plan for Renewable Rikers. (2022). The Renewable Rikers Coalition, Regional Plan Association, Johnson, A. and the J.M. Kaplan Fund. Community Organization.Rikers Island and other DOC facilities are not fully air conditioned, increasing heat vulnerability for those incarcerated and working inside, which is of increasing concern as climate change increases average temperatures and the frequency of heat waves.119New York City Jail Conditions and Operations During Heat Emergency. (2019). NYC Board of Correction. NYC Government.Portions of Rikers Island are located within the current and projected 100-year floodplain.120NYC Flood Hazard Mapper. (2017). NYC DCP. NYC Government. Any formal studies of environmental and health impacts on the island are not publicly available.
In 2021, the New York City Council passed the “Renewable Rikers Act,” which would transfer the land, buildings and facilities of Rikers Island from DOC to the Department of Citywide Administrative Services (DCAS) ahead of a 2027 deadline that prohibits Rikers Island from being used for incarceration. The Act also requires a feasibility study to determine whether different types of renewable energy sources and infrastructure, combined with battery storage, are feasible on Rikers Island.121Council Votes to Pass the “Renewable Rikers Act”. (2021). NYC City Council. NYC Government.
A 2006 research project by the Columbia University Center for Spatial Research revealed concentrated areas of public spending on incarceration in New York City. The spatial analysis in the “Million Dollar Blocks” research project identified several city blocks where the City and State correctional agencies are spending in excess of one million dollars to incarcerate people from each of those blocks—all within the predominantly Black and Hispanic/Latino neighborhood of East New York, Brooklyn.122Million Dollar Blocks. (2006). Columbia University Center for Spatial Research. Academic Institution.The researchers suggested this was an opportunity to reflect on what would happen if the funding spent to incarcerate individuals was routed to public programs.
Interconnected EJ Issues
The effects of exposure to multiple environmental and climate hazards, health vulnerabilities, and social factors often interconnect and compound one another. The following topics are examples of interconnected EJ issues.
Poor Physical and Mental Health Outcomes
Environmental injustices threaten the city’s resiliency by straining the health and wellbeing of communities already impacted by existing health vulnerabilities. These threats to health and resilience impact residents in multiple ways, some obvious and some more hidden. Current and looming climate stressors that threaten to worsen economic and social inequities can lead to psychological insecurity and stress, thereby decreasing mental and emotional wellbeing of New Yorkers. Aspects of the built environment, such as mobile and stationary sources of pollution expose nearby residents to noise, traffic, and air pollution. These environmental stressors can lead to high rates of respiratory issues, cancer, cardiovascular disease, increased stress, anxiety and other adverse physical and mental health outcomes, particularly for those situated near multiple sources of pollution.
Housing Insecurity and Maintenance Defects
The high cost of housing in New York City can leave many low-income households in precarious living situations. People living in high-risk flood zones face an added risk of displacement, due to the potential for property damage, the high cost of flood repairs, and high flood insurance premiums. This risk is worse for neighborhoods with insufficient stormwater infrastructure and households that lack access to the financial resources to address housing needs and damages. Poor quality housing with persistent problems like cracks, holes, and water leaks can also lead to health-related home hazards, such as peeling paint, pest infestations and mold. These conditions contribute to the development or worsening of health issues including lead poisoning and asthma.
Cumulative Impacts
Impacts of environmental justice issues (individually or combined) can affect health and well-being over time. Vulnerable populations, including communities of color, low income communities, youth, older adults, and those with pre-existing medical conditions, are especially at risk. Take a look at how intersecting environmental justice issues affect some New Yorkers.

Topic Areas and Corresponding EJ Issues and Indicators
|
ACCESS TO RESOURCES |
EXPOSURE TO POLLUTED AIR |
EXPOSURE TO HAZARDOUS MATERIALS |
ACCESS TO SAFE AND HEALTHY HOUSING |
EXPOSURE TO POLLUTED WATER |
EXPOSURE TO CLIMATE CHANGE |
|
Redlining Capital Planning Land Use Planning and Zoning Transit and Alternative Transportation Access Open Space and Natural Resources Food and Nutrition |
Outdoor Air Pollution Stationary Sources of Pollution Mobile Sources of Pollution Solid Waste Facilities Indoor Air |
Hazardous Waste Generators and Storage Facilities Contaminated Land Hazardous Material Incidents |
Housing Affordability Health-related Housing Maintenance Issues Public Housing Utility Access and Affordability Lead in Housing Plumbing Noise |
Polluted Water Bodies Stormwater Management |
Extreme Heat Coastal Storm Surge Chronic Tidal Flooding Extreme Rainfall |
In the subsequent sections within this chapter, EJ issues and indicators are analyzed with the intent of answering the following questions:
What are the environmental issues and associated EJ concerns and risk factors?
Who is most affected by or vulnerable to the EJ concern?
How does the EJ concern affect EJ communities based on quantitative and qualitative research and input from the EJ Advisory Board?
Where are the EJ concerns concentrated? What spatial and data analysis provides support to
- assess the distribution of environmental benefits and burdens?
- identify locations and attributes of infrastructure which may cause or exacerbate EJ concerns?
- identify concentrations of complaints and violations of City environmental regulations which may reflect EJ concerns?
- identify areas experiencing multiple, compounding EJ concerns?
How do the EJ concerns overlap and relate?
How do climate change and intersecting issues, such as the COVID-19 pandemic, affect or exacerbate EJ concerns?
What are the related data gaps with an eye toward a research agenda for the future EJNYC Plan?
Climate Vulnerability
Climate change is a “threat multiplier” that increases risks of physical and mental health and social vulnerabilities and exacerbates pre-existing inequalities. For example, Black New Yorkers are most likely to lack access to functioning air conditioning, and twice as likely to die from heat stress as white New Yorkers.1232023 New York City Heat-Related Mortality Report. (2023). NYC DOHMH. NYC Government. This climate vulnerability is exacerbated when neighborhoods also lack access to the environmental benefits that mitigate climate hazards, such as green space and tree coverage.
Climate Change and Air Quality
Climate change is predicted to cause more frequent, severe, and longer-lasting extreme heat events.124NYC Climate Risk Information 2022: Observations and Projections. (2023). Braneon, C., Ortiz, L., Bader, D., et al. Annals of the New York Academy of Sciences. Academic Research. Periods of elevated temperatures can worsen air pollution because hot weather facilitates the formation of ground-level ozone.125Climate Change Impacts on Air Quality. (2022). US EPA. US Government. Drier conditions and drought can also lead to more frequent wildfires, which can spread dangerous pollution hundreds of miles.126Ibid. In New York City, communities with the highest rates of pollution-attributable emergency visits are often the most vulnerable to heat due to a lack of green space in their neighborhood and less access to air conditioning.127Environment and Health Data Portal: Interactive Heat Vulnerability Index. (2022). NYC DOHMH. NYC Government., 128Environment and Health Data Portal: Health impacts of air pollution. (2022). NYC DOHMH. NYC Government Additionally, increases in storms and precipitation due to climate change can create damp indoor environments that impact indoor air quality and result in mold growth.129Climate Change Impacts on Air Quality. (2022). US EPA. US Government.
Housing Quality and Indoor Air Quality
Poor housing quality can lead to elevated levels of indoor air pollution, particularly in low-income households. Inadequate ventilation, which is more prevalent in housing of low-income New Yorkers, can lead to the accumulation of indoor air pollutants.130Introduction to Indoor Air Quality. (2023). US EPA. US Government. Leaky or poorly sealed homes can result in the infiltration of outdoor air pollutants into the home. Inadequate housing maintenance can lead to home health hazards like pest infestation and mold growth, and dust from unsafe renovation or repair work are all potential asthma triggers. Poor indoor air quality is associated with other negative health impacts like eye, nose, and throat irritation, headaches, dizziness, fatigue, cancer, heart disease, and other respiratory diseases.131Indoor Air Quality. (2023). US EPA. US Government.
Flooding and Hazardous Materials
The concentration of hazardous waste generators, storage facilities, chemically intensive small businesses, and known brownfields along the industrial waterfront presents a compounding challenge in the face of climate change. Rising sea levels, increased annual rainfall, and more days of intense precipitation will lead to an increase in more frequent and severe flooding.132NYC Climate Risk Information 2022: Observations and Projections. (2023). Braneon, C., Ortiz, L., Bader, D., et al. Annals of the New York Academy of Sciences. Academic Research. There are clear regulations governing the storage of hazardous materials in facilities located in flood zones, but some businesses may not safely store their hazardous materials in the event of a flood. During a flood, improperly stored or abandoned materials can inundate the surrounding communities with hazardous chemicals, complicating cleanup efforts and worsening health impacts and contamination in the surrounding communities.133Toxic Floodwaters: Strengthening the Chemical Safety Regime for the Climate Change Era. (2020). Sachs, N. Columbia Journal of Law, 46(1). Academic Research. Further, the EPA warns that potential impacts from sea level rise can lead to contaminant releases from Treatment, Storage, and Disposal Facilities (TSDFs) such as landfills and seep into groundwater supplies, and that flooding from extreme precipitation could transport contaminants in surface waters and runoff to downstream populations.134Effects of Coastal Sea Level Rise on US Hazardous Waste. (2023). US EPA. US Government. Additionally, a study published in the National Library of Medicine concludes that contamination may likely migrate from known brownfields into surrounding communities due to flooding.135Chemical contamination of soils in the New York City area following Hurricane Sandy. (2015). Mandigo, A., DiScenza, D., Keimowitz, A., and Fitzgerald, N. Environmental Geochemistry and Health, 38(5). Academic Research. Facilities should be analyzed on an individual basis in order to assess specific risks and mitigate threats to hazardous waste facilities due to climate change.136Effects of Coastal Sea Level Rise on US Hazardous Waste (2023). US EPA. US Government.
Potential Improvements to the New York State Disadvantaged Communities Criteria
Despite the advantages of using the State’s DAC designation to define NYC’s EJ Areas in this report, the DAC criteria methodology has some notable limitations and does not reflect the locations and extent of all EJ communities in NYC. Crucially, the DAC criteria methodology is designed to be updated over time and the State mandates that the criteria be reviewed at least annually to make improvements where possible.
This section includes an analysis of potential improvements to the current DAC criteria methodology with the aim of contributing to the methodology’s ongoing refinement. New York City government wants to ensure that EJ communities are appropriately represented by the DAC designation and equitably positioned to receive commensurate State funding. For a more detailed explanation of the DAC criteria methodology and the potential improvements proposed herein, please refer to the Technical Supplement: Potential Improvements to the NYS Disadvantaged Communities Criteria (p. 190) in the Appendix.
Overview of the Current Methodology
The 45 sociodemographic and environmental indicators used by the DAC identification methodology were selected from a larger body of available data comprised of over 100 variables based on data availability, accuracy, and relevance to describing climate justice at the census tract level.
Individual indicators were grouped thematically and weighted to produce seven factor scores. These factor scores were weighted and combined to produce two component scores, which were then summed to create the final combined score for each census tract. These final scores were then ranked and used to determine which census tracts are designated as DACs.
This methodology identifies areas that exhibit high scores across both components (Environmental Burdens and Climate Change Risks as well as Population Characteristics and Health Vulnerabilities). However, there are certain areas in New York State that are not classified as DACs because they score highly in one of the individual components but not both. As a result, there are areas that are grappling with environmental burdens or public health concerns that do not meet the criteria for inclusion as a DAC.
This is particularly concerning for communities of color and low-income communities with low scores for Environmental Burdens and Climate Change Risk. Most census tracts in Southeast Queen are not designated as DACs because they do not have a score that meets the selection threshold in the Environmental Burdens and Climate Change Risks component, despite having a high score in the Population and Health Vulnerabilities component.
NYS DAC Criteria Methodology
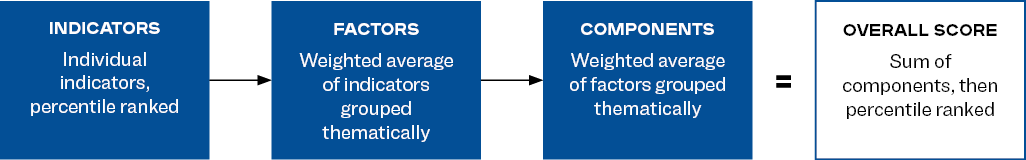
NYS DAC Criteria Methodology: Factors and Components

This methodology has other limitations that reflect the difficulties in capturing how environmental justice is experienced locally using quantitative data available statewide. First, environmental justice issues that are not uniformly measured at the state level are excluded from the DAC criteria. Second, there are always differences between actual experiences and the conditions that can be recorded through spatial data.
Potential Improvements to the Current Methodology
Modifying the Dac Ranking System
The DAC methodology provides an understanding of burden and vulnerability relative to the rest of the state. It uses a multi-step ranking system (consisting of both statewide and regional ranking) to adjust for NYC’s much higher rates of burden and vulnerability relative to the rest of the state. The regional ranking is done to ensure that census tracts from a greater variety of areas across the state ultimately receive DAC designation. Based on the current methodology, 44 percent of NYC census tracts and 29 percent of census tracts in the rest of the state are designated as DACs. However, this ranking system has the effect of excluding hundreds of New York City census tracts that would otherwise be classified as DACs if census tracts were only ranked statewide.
If a statewide ranking were used only 55 percent of NYC tracts and 20 percent of tracts in the rest of the state would be designated as DACs. This would more accurately reflect the distribution of environmental burden and vulnerability across the state and would more equitably position NYC census tracts for Climate Act funding, commensurate with the relative burdens and vulnerabilities experienced by these communities.
Modifying the Dac Indicators
This analysis also identified several indicators, listed below, that should be considered for inclusion or exclusion in future revisions to the DAC criteria. Additional information on these potential updates can be found in the Technical Supplement: Potential Improvements to the NYS Disadvantaged Communities Criteria (p. 190) in the Appendix.
Pluvial Flooding The DAC indicator related to inland flooding excludes pluvial flooding, which occurs when extreme rainfall creates a flood (independent of an overflowing water body). Pluvial flooding is a significant issue for many New York City neighborhoods, where this type of flooding is more prevalent due to a greater proportion of impervious surfaces compared to other areas in the state. The NYC Stormwater Flood Map – Extreme Flood with 2080 Sea Level Rise dataset, provided by the City of New York, provides a more complete understanding of inland flooding as it incorporates pluvial flooding. Statewide analysis of stormwater flooding should be conducted so that this significant measure of climate change risk can be included for communities across New York State.
Noise Pollution When the DAC criteria were initially drafted, a comprehensive dataset that measured noise pollution statewide did not exist. In November 2022, the US Bureau of Transportation Statistics (BTS) published the National Transportation Noise map, which represents the intensity of transportation-related noise pollution based on 24-hour equivalent sound levels for aviation, road, and rail-based transportation. This dataset provides insight into the geography of noise pollution across New York State and is suggested for inclusion in future DAC criteria.
Proximity to Wastewater Discharge This measure accounts for proximity to toxicity- weighted concentrations of pollutants with potential negative health effects. As currently used, this proximity-based measure does not account for several factors that make proximity to wastewater discharges, on their own, at least in New York City, unlikely to result in exposure to pollution. Therefore, it should be excluded from future DAC criteria.
Housing Vacancy Rates The DAC methodology states that this indicator was included to measure community disinvestment. In NYC however, the highest rates of housing vacancy occur among high-cost and luxury housing.137The 2021 New York City Housing and Vacancy Survey: Selected Initial Findingsv. (2022). Gaumer, E. NYC HPD. NYC Government. This indicator may favor advantaged areas where market rate buildings have lower occupancy rates due to high rent prices. In actual areas of disinvestment where there may be large amounts of affordable housing, housing
vacancy rates will typically be extremely low. While this trend may vary for other areas in the state, including this variable for New York City does not capture the intended trends and it is highlighted for consideration for exclusion from the DAC criteria in the future.
Combining the Potential Modifications to the Dac Criteria Methodology
If the modifications outlined in this analysis were incorporated, it would increase the number of DACs designated within New York City and increase the City’s allocation of State funding under the Climate Act. The following map shows the result of modifying the current DAC criteria methodology to use statewide ranking only, include indicators for stormwater and noise, and exclude indicators for wastewater and housing vacancy.
Together, these adjustments would add 485 DAC census tracts in NYC and redistribute 15 tracts within the city. Based on this revised methodology, 65 percent of census tracts in NYC would be DACs, compared with 12 percent of NYS census tracts outside of NYC.
Frontline communities most impacted by present and historical environmental burdens should benefit from Climate Act funding first. Across a variety of indicators, New York City is disproportionately burdened by and vulnerable to environmental and climate hazards relative to the rest of the state. As illustrated in this analysis, several aspects of the current DAC criteria methodology result in deprioritizing certain NYC census tracts from receiving a DAC designation. The exclusion of these communities risks exacerbating existing disparities and perpetuating longstanding patterns of disinvestment. The City is strongly committed to advocating for New York City’s fair share of State investment to deliver the environmental justice that New Yorkers deserve.
Census Tracts That Would Be Added as DACs Using Statewide Ranking
This map displays changes to DAC census tracts that would result from using a statewide ranking method only, instead of also separately considering rankings among tracts outside of NYC.
![]()
SOURCE: NYS Department of Environmental Conservation, Disadvantaged Communities Criteria, 2023. NYC Department of City Planning, 2010 Census Tracts, 2010.
Census Tracts Added as DACs Using Statewide Ranking and Revised Indicators
This map displays changes to DAC census tracts that would result from using revised methodology that uses a statewide ranking, adds indicators for stormwater flooding and noise and removes current indicators for wastewater discharge and housing vacancy.

SOURCE: NYS Department of Environmental Conservation, Disadvantaged Communities Criteria, 2023. NYC Department of City Planning, 2010 Census Tracts, 2010. NYC Department of Environmental Protection, NYC Stormwater Flood Map – Extreme Flood with 2080 Sea Level Rise, 2022. US Department of Transportation Bureau of Transportation Statistics, Continental U.S. road, freight and passenger rail, and aviation noise, 2020.